Diagnosed with CIS suggestive of Multiple Sclerosis (MS) in December 2024; previously diagnosed with Functional Neurological Disorder (FND).
FND is a condition in which some believe that psychological factors cause/convert into physical symptoms resembling neurological disorders, or rather in the more recent definition an unknown disruption in neural communication it the brain. Diagnosis primarily relies on clinical observations due to the absence of organic evidence.A significant concern (especially with the advent of the DSM-5 criteria) is that it can hinder the proper collection of genuine medical data, as the diagnosis often prematurely concludes investigations.
We prefer to approach this condition as a neurological illness of unknown etiology, and we contest that it warrants further investigation.
Rather than relying on what is comparable to belief, we advocate for a more evidence-based approach that involves ongoing monitoring and periodic MRI scans whenever possible.
Symptoms
Short term memory issues / fuzzy brainSlurred speech / periodic voice tremorsVertigo (worse with optic/auditory stimulation)Facial asymmetryBalance and gait problemsPeriodic right-hand tremorsTingling in fingertips and toes, loss in fingers dexterityHeadaches, neck and muscle pain, along with Lhermitte’s sign.Eye strain (right hand side), faded colours, eye socket pain, difficulty closing eyes.Fluctuating heart rate / blood pressureFatigue getting worse as the day progresses.
Family history
Mother – Epilepsy, Lung cancer
Grandfather – Prostate cancer
Grandmother – Liver cancer
Clinical observations
Negative Hoover’s sign Absence of entrainment or other internal inconsistencies GCS15/15 PERRL ﴾+﴿, Right eye pupillary reflex slowed compared to Left Mobilizing with crutch, unsteady gait with right foot inversion Noted to have sensory deficit on RHS compared to LHS on legs Sensory deficit on LHS compared to RHS on Abdomen ? Asymmetrical Paraesthesia Right hand resting tremor, worsened on intention Power: UL: 5/5 bilaterally LL: 4/5 RHS; 5/5 LHS Tone: Normotonic Reflexes: ‐Absent abdominal reflexes, mildly elevated reflexes on right, Non pathological Babinski +Lhermitte Sign +Trendelenburg's sign + Dysmetria + Dysdiadochokinesia + Romberg Test + Ulnar drift
Timeline
29 events
No timeline entries match this filter.
2017-08General
Activity for 2017-08
1 event,
0 medicines,
0 lab results,
0 scans
Events
General
Started walking into things
35 years
2018-12General
Activity for 2018-12
1 event,
0 medicines,
0 lab results,
0 scans
Events
General
Stopped using birth control
36 years
2019-03Gastroenterology
Activity for 2019-03
1 event,
0 medicines,
51 lab results,
4 scans
Events
Gastroenterology
Severe swelling of abdomen, to the point where she looked 7 months pregnant, sent home with no diagnosis
37 years
Lab results
Chemistry
Haemotology
Scans
2019-03-26
4 items
Abdomen
Series001ab
Series 001
Series002ab
Series 002
Series004ab
Series 004
Series005ab
Series 005
2020-01Gastroenterology
Activity for 2020-01
1 event,
0 medicines,
49 lab results,
0 scans
Events
Gastroenterology
Severe swelling of abdomen, to the point where she looked 7 months pregnant, sent home with IBS diagnosis, sudden lactose and gluten intolerances
37 years
Lab results
Chemistry
Haemotology
Molecular Biology
2020-06Gastroenterology
Activity for 2020-06
1 event,
0 medicines,
20 lab results,
0 scans
Events
Gastroenterology
Investigations around unexplainable weight gain
38 years
Lab results
Haemotology
2021-01General
Activity for 2021-01
1 event,
0 medicines,
0 lab results,
0 scans
Events
General
Joined HPC for rehabilitation
38 years
2021-02Gynaecology
Activity for 2021-02
1 event,
0 medicines,
0 lab results,
0 scans
Events
Gynaecology
Initial PCOS diagnosis
38 years
2021-04Urology
Activity for 2021-04
1 event,
0 medicines,
24 lab results,
0 scans
Events
Urology
Robotic ureteroscopy, kidney stones removed
39 years
Lab results
Chemistry
Haemotology
2021-05General
Activity for 2021-05
1 event,
0 medicines,
9 lab results,
0 scans
Events
General
More investigations around unexplained weight gain
39 years
Lab results
Chemistry
2021-08General
Activity for 2021-08
1 event,
0 medicines,
0 lab results,
0 scans
Events
General
15-50% deficits discovered on the dominant side of her body
39 years
Gynaecology
Perimenopause diagnosis
40 yearsGeneral
Disturbances in right eye, struggling to close eyes, when closed vertigo, nausea, headaches
40 years
Medicine
VISANNE 2MGSOMNIL 25MG
Lab results
Chemistry
2022-09Neurological
Activity for 2022-09
1 event,
2 medicines,
43 lab results,
0 scans
Events
Neurological
Sudden loss of balance, wheelchair bound, vertigo, facial assymetry observed, tremor in the right hand
40 years
Medicine
VISANNE 2MGSOMNIL 25MG
Lab results
Chemistry
Haemotology
Molecular Biology
2022-10Neurological
Activity for 2022-10
1 event,
5 medicines,
37 lab results,
19 scans
Events
Neurological
Cervical stenosis observed on MRI, worsening of symptoms, problems with gait getting worse
40 years
Serum bicarbonate reflects the main buffering base in blood and helps assess metabolic acid-base balance.
Lower: 21Upper: 31Unit: mmol/L
Lower: Low bicarbonate may be seen with metabolic acidosis, kidney disease, diarrhoea, lactic acidosis, ketoacidosis, or compensation for respiratory alkalosis.
Upper: High bicarbonate may be seen with metabolic alkalosis, vomiting, diuretics, mineralocorticoid excess, or compensation for chronic respiratory acidosis.
S-Copper
Serum copper measures copper in blood, much of which is bound to caeruloplasmin, and is used to assess copper metabolism.
Lower: 12.6Upper: 24.3Unit: umol/L
Lower: Low serum copper may be seen with copper deficiency, low caeruloplasmin, malabsorption, excess zinc, or Wilson disease patterns.
Upper: High serum copper may be seen with inflammation, pregnancy, oestrogen use, cholestasis, liver disease, or copper excess.
No numeric scale available.
S-Caeruloplasmin
Caeruloplasmin is a copper-carrying protein made by the liver and used in assessing copper metabolism and Wilson disease.
Lower: 25Upper: 60Unit: mg/dl
Lower: Low caeruloplasmin may be seen with Wilson disease, copper deficiency, protein loss, severe liver disease, or inherited low levels.
Upper: High caeruloplasmin may be seen with inflammation, infection, pregnancy, oestrogen use, or liver/bile duct disease.
No numeric scale available.
Blood pH
Blood pH measures the acidity or alkalinity of blood and is central to acid-base assessment.
Lower: 7.36Upper: 7.44Unit: pH
Lower: Low pH means acidaemia and may occur with metabolic or respiratory acidosis.
Upper: High pH means alkalaemia and may occur with metabolic or respiratory alkalosis.
No numeric scale available.
Alpha-1-Globulin
Alpha-1 globulins are blood proteins measured during serum protein electrophoresis and include proteins involved in inflammation and transport.
Lower: 2.1Upper: 3.5Unit: g/L
Lower: Low levels may be seen with alpha-1 antitrypsin deficiency, liver disease, or protein loss.
Upper: High levels may be seen with inflammation, infection, tissue injury, or other acute-phase responses.
No numeric scale available.
Alpha-2-Globulin
Alpha-2 globulins are blood proteins measured during serum protein electrophoresis and include inflammatory and transport proteins.
Lower: 5.1Upper: 8.5Unit: g/L
Lower: Low levels may be seen with liver disease, malnutrition, haemolysis, or protein loss.
Upper: High levels may be seen with inflammation, nephrotic syndrome, infection, or tissue injury.
No numeric scale available.
Beta-Globulin
Beta globulins are proteins measured on serum protein electrophoresis and include transferrin, complement, and some immunoglobulins.
Lower: 6Upper: 9.4Unit: g/L
Lower: Low levels may be seen with malnutrition, liver disease, immune deficiency, or protein loss.
Upper: High levels may be seen with inflammation, iron deficiency patterns, liver disease, hyperlipidaemia, or monoclonal proteins.
No numeric scale available.
Gamma-Globulin
Gamma globulins are mainly immunoglobulins measured on serum protein electrophoresis and reflect antibody-related proteins.
Lower: 8Upper: 13.5Unit: g/L
Lower: Low levels may be seen with immune deficiency, protein loss, some medicines, or reduced antibody production.
Upper: High levels may be seen with chronic infection, autoimmune disease, inflammation, liver disease, or monoclonal gammopathy.
No numeric scale available.
Paraprotein Concentration
Paraprotein concentration measures the amount of a monoclonal immunoglobulin protein detected in blood.
Qualitative result
No numeric scale available.
B-PCO₂
Lower: 4.5Upper: 6.1Unit: kPa
No numeric scale available.
B-PO₂
Lower: 11Upper: 15Unit: kPA
No numeric scale available.
B-ACTUAL BICARBONATE
Actual bicarbonate reflects the bicarbonate concentration in blood at the time of sampling and helps assess metabolic acid-base status.
Lower: 23Upper: 27Unit: mmol/l
Lower: Low bicarbonate may be seen with metabolic acidosis, compensation for respiratory alkalosis, kidney disease, diarrhoea, lactate, ketones, or severe illness.
Upper: High bicarbonate may be seen with metabolic alkalosis, compensation for chronic respiratory acidosis, vomiting, diuretics, or mineralocorticoid excess.
No numeric scale available.
B-STANDARD BICARBONATE
Standard bicarbonate estimates bicarbonate after adjusting for a standard carbon dioxide level, helping assess the metabolic component of acid-base balance.
Lower: 23Upper: 27Unit: mmol/l
Lower: Low values may suggest metabolic acidosis or renal/respiratory compensation patterns.
Upper: High values may suggest metabolic alkalosis or compensation for chronic respiratory acidosis.
No numeric scale available.
B-OXYGEN SATURATION
Blood oxygen saturation estimates the percentage of haemoglobin carrying oxygen and reflects oxygenation at the time of sampling.
Lower: 95Upper: 99Unit: %
Lower: Low saturation may suggest hypoxaemia from lung, heart, circulation, anaemia-related, or sampling issues, depending on sample type.
Upper: High saturation is usually expected with normal oxygenation or supplemental oxygen and is rarely a problem by itself.
No numeric scale available.
Lipaemic
Lipaemic index reflects excess fat particles in the blood sample, which may interfere with some laboratory tests.
Qualitative result
No numeric scale available.
P-Lactate
Plasma lactate reflects anaerobic metabolism and tissue oxygen use and is used in evaluating shock, sepsis, hypoxia, seizures, and metabolic stress.
Lower: 0.5Upper: 2.2Unit: mmol/L
Lower: Low lactate is usually not clinically significant.
Upper: High lactate may be seen with poor tissue perfusion, sepsis, hypoxia, seizures, intense exercise, liver dysfunction, medicines, or mitochondrial/metabolic disorders.
No numeric scale available.
Icteric
Icteric index reflects yellow pigment, usually bilirubin, in the blood sample and may indicate sample interference or jaundice.
Qualitative result
No numeric scale available.
Copper Urine
Urine copper measures copper eliminated in urine and is used in assessing copper metabolism and possible Wilson disease.
Lower: 5Upper: 100Unit: ug/L
Lower: Low urine copper may be seen with copper deficiency, low intake, incomplete collection, or low excretion states.
Upper: High urine copper may be seen with Wilson disease, liver disease, copper overload, inflammation, or chelation treatment.
CSF-Albumin
CSF albumin measures albumin in cerebrospinal fluid and is used to assess blood-brain barrier or blood-CSF barrier function.
Lower: 139Upper: 246Unit: mg/L
Lower: Low values are usually not clinically significant.
Upper: High values may suggest barrier dysfunction, inflammation, infection, spinal block, or blood contamination, depending on context.
No numeric scale available.
S-Albumin
Serum albumin is the main blood plasma protein and reflects fluid balance, liver synthesis, protein loss, nutrition, and inflammation.
Lower: 34Upper: 50Unit: g/L
Lower: Low serum albumin may be seen with inflammation, liver disease, kidney protein loss, malnutrition, bowel protein loss, severe illness, or fluid overload.
Upper: High serum albumin is uncommon and most often reflects dehydration or sample concentration.
CSF-IgG
CSF IgG measures immunoglobulin G in cerebrospinal fluid and helps assess immune activity within the central nervous system.
Lower: 20Upper: 40Unit: mg/L
Lower: Low CSF IgG is usually not clinically significant on its own.
Upper: High CSF IgG may be seen with CNS inflammation, infection, autoimmune disease, or blood-brain barrier dysfunction.
No numeric scale available.
S-IgG
Serum IgG is the main immunoglobulin in blood and reflects part of the adaptive immune response.
Lower: 7Upper: 16Unit: g/L
Lower: Low IgG may be seen with immune deficiency, protein loss, some medicines, haematological disease, or after immunosuppressive therapy.
Upper: High IgG may be seen with chronic infection, autoimmune disease, liver disease, inflammation, or monoclonal gammopathy.
No numeric scale available.
CSF:Serum Alb Ratio
The CSF:serum albumin ratio compares albumin in cerebrospinal fluid and blood to assess blood-brain barrier integrity.
Upper: 8.9Unit: mg/g
Lower: Low ratios are generally not clinically significant.
Upper: High ratios may suggest blood-brain barrier or blood-CSF barrier dysfunction, inflammation, infection, or impaired CSF flow.
No numeric scale available.
IgG Index
IgG index compares IgG levels in CSF and serum to assess possible antibody production within the central nervous system.
Lower: 0.34Upper: 0.7
Lower: Low or normal values generally do not suggest increased intrathecal IgG production.
Upper: High values may suggest immune activity within the central nervous system, as seen in multiple sclerosis or other inflammatory/infectious CNS disorders.
No numeric scale available.
Oligoclonal bands
Oligoclonal bands are antibody bands detected in CSF and/or serum, used to assess immune activity within the central nervous system.
Qualitative result
No numeric scale available.
Macroscopic Appearance
Macroscopic appearance describes the visible colour and clarity of cerebrospinal fluid.
Qualitative result
No numeric scale available.
Copper - DU
Copper-DU appears to refer to a copper measurement in a daily urine or duplicate urine context, used in assessing copper metabolism.
Lower: 40Upper: 60Unit: ug/24hr
Lower: Low values may be seen with low copper intake, reduced copper excretion, or collection issues, depending on the test method.
Upper: High values may be seen with increased copper excretion, Wilson disease evaluation, liver disease, inflammation, or copper exposure.
No numeric scale available.
Haemolysis
Haemolysis indicates red blood cell breakdown in the sample or in the body, depending on context.
Qualitative result
No numeric scale available.
P-Homocysteine
Plasma homocysteine is an amino-acid-related marker influenced by B vitamins, kidney function, genetics, and metabolic status.
Lower: 5Upper: 15Unit: umol/L
Lower: Low homocysteine is usually not clinically significant.
Upper: High homocysteine may be seen with B12, folate, or B6 deficiency, kidney disease, hypothyroidism, some medicines, or inherited metabolism differences.
No numeric scale available.
CRP
C-reactive protein is a non-specific blood marker of inflammation produced by the liver.
Upper: 5Unit: mg/L
Lower: Low CRP generally suggests no major systemic inflammatory response at the time of testing.
Upper: High CRP may be seen with infection, autoimmune inflammation, tissue injury, surgery, malignancy, or other inflammatory conditions.
Sodium
Sodium is the main extracellular electrolyte and is essential for fluid balance, nerve function, and brain cell water balance.
Lower: 135Upper: 145Unit: mmol/L
Lower: Low sodium may be seen with excess water, diuretics, vomiting, diarrhoea, heart/liver/kidney disease, SIADH, adrenal insufficiency, or some medicines.
Upper: High sodium may be seen with dehydration, water loss, inadequate intake, diabetes insipidus, excessive salt intake, or impaired thirst/access to water.
Potassium
Potassium is an electrolyte essential for heart rhythm, nerve signalling, and muscle function.
Lower: 3.5Upper: 5.1Unit: mmol/L
Lower: Low potassium may be seen with vomiting, diarrhoea, diuretics, insulin shifts, poor intake, magnesium deficiency, or hormone disorders.
Upper: High potassium may be seen with kidney impairment, medicines, acidosis, cell breakdown, adrenal insufficiency, or sample haemolysis.
Chloride
Chloride is an electrolyte that helps maintain fluid balance, electrical neutrality, and acid-base balance.
Lower: 98Upper: 107Unit: mmol/L
Lower: Low chloride may be seen with vomiting, diuretics, metabolic alkalosis, fluid overload, or certain kidney and hormone disorders.
Upper: High chloride may be seen with dehydration, saline administration, kidney tubular problems, diarrhoea, or metabolic acidosis.
Total CO2
Total CO2 mostly reflects bicarbonate in serum and is used as a marker of metabolic acid-base status.
Lower: 21Upper: 31Unit: mmol/L
Lower: Low total CO2 may suggest metabolic acidosis, kidney disease, diarrhoea, lactic acidosis, ketoacidosis, or compensation for respiratory alkalosis.
Upper: High total CO2 may suggest metabolic alkalosis, vomiting, diuretics, mineralocorticoid excess, or compensation for chronic respiratory acidosis.
Anion Gap
The anion gap is a calculated value that helps assess acid-base balance and the presence of unmeasured acids in blood.
Lower: 8Upper: 20Unit: mmol/L
Lower: A low anion gap is uncommon and may be due to low albumin, lab variation, paraproteins, or certain intoxications.
Upper: A high anion gap may suggest metabolic acidosis from causes such as lactate, ketones, kidney failure, toxins, or severe illness.
Urea
Urea is a waste product from protein metabolism and is used with creatinine to assess kidney function, hydration, and protein metabolism.
Lower: 2.5Upper: 7.8Unit: mmol/L
Lower: Low urea may be seen with low protein intake, liver disease, overhydration, pregnancy, or malnutrition.
Upper: High urea may be seen with dehydration, kidney impairment, gastrointestinal bleeding, high protein intake, catabolic states, or steroid use.
Creatinine
Creatinine is a waste product from muscle metabolism filtered by the kidneys and commonly used with eGFR to assess kidney function.
Lower: 49Upper: 90Unit: umol/L
Lower: Low creatinine may reflect low muscle mass, pregnancy, low meat intake, or dilution and is often not harmful on its own.
Upper: High creatinine may suggest reduced kidney filtration, dehydration, urinary obstruction, high muscle breakdown, medicines, or high meat intake.
eGFR (CKD-EPI)
eGFR estimates kidney filtration rate from creatinine using the CKD-EPI equation and is used to assess kidney function.
Lower: 90Upper: 120Unit: mL/min
Lower: Low eGFR may suggest reduced kidney function, acute kidney injury, chronic kidney disease, dehydration, obstruction, or creatinine-related estimation effects.
Upper: High eGFR is often normal, especially in younger people, but may sometimes reflect hyperfiltration in diabetes, pregnancy, or high-flow kidney states.
Calcium Total
Total calcium measures calcium in blood, including protein-bound and free calcium, and is important for bone, nerve, muscle, and heart function.
Lower: 2.15Upper: 2.5Unit: mmol/l
Lower: Low total calcium may be seen with low albumin, vitamin D deficiency, hypoparathyroidism, kidney disease, magnesium deficiency, or acute illness.
Upper: High total calcium may be seen with hyperparathyroidism, malignancy, vitamin D excess, dehydration, medicines, or granulomatous disease.
Calcium Albumin-Adjusted
Albumin-adjusted calcium estimates calcium after correcting for albumin level, aiming to better reflect physiologically relevant calcium status.
Lower: 2.15Upper: 2.5Unit: mmol/l
Lower: Low adjusted calcium may suggest hypocalcaemia from vitamin D deficiency, hypoparathyroidism, kidney disease, magnesium deficiency, or other causes.
Upper: High adjusted calcium may suggest hypercalcaemia from hyperparathyroidism, malignancy, vitamin D excess, medicines, or other causes.
Urate
Urate is a breakdown product of purine metabolism and is used in assessing gout risk, kidney stones, and some metabolic states.
Lower: 0.16Upper: 0.36Unit: mmol/l
Lower: Low urate is usually not clinically significant but may be seen with some medicines, kidney tubular issues, or rare metabolic conditions.
Upper: High urate may be seen with gout risk, kidney impairment, dehydration, high purine intake, alcohol use, metabolic syndrome, cell breakdown, or some medicines.
No numeric scale available.
Calcium Corrected(G)
Corrected calcium is a calculated estimate of calcium adjusted for albumin level.
Lower: 2.15Upper: 2.5Unit: mmol/l
Lower: Low corrected calcium may be seen with vitamin D deficiency, hypoparathyroidism, kidney disease, magnesium deficiency, or acute illness.
Upper: High corrected calcium may be seen with hyperparathyroidism, malignancy, vitamin D excess, granulomatous disease, medicines, or dehydration.
No numeric scale available.
Magnesium
Magnesium is an electrolyte important for nerve, muscle, heart rhythm, bone, and enzyme function.
Lower: 0.66Upper: 1.07Unit: mmol/l
Lower: Low magnesium may be seen with poor intake, diarrhoea, vomiting, diuretics, alcohol use, diabetes, kidney losses, or some medicines.
Upper: High magnesium may be seen with kidney impairment, excessive supplementation, magnesium-containing medicines, or severe illness.
Phosphate
Phosphate is an electrolyte important for bone, energy metabolism, muscle, and cell function.
Lower: 0.78Upper: 1.42Unit: mmol/l
Lower: Low phosphate may be seen with refeeding, vitamin D deficiency, hyperparathyroidism, alcohol use, malnutrition, kidney losses, or some medicines.
Upper: High phosphate may be seen with kidney impairment, hypoparathyroidism, cell breakdown, acidosis, excessive intake, or sample haemolysis.
Parathyroid Hormone
Parathyroid hormone regulates calcium and phosphate balance and is used to evaluate calcium disorders, vitamin D status, and parathyroid function.
Lower: 1.5Upper: 6.9Unit: pmol/L
Lower: Low PTH may suggest hypoparathyroidism, suppressed parathyroid activity from high calcium, magnesium disorders, or postsurgical causes.
Upper: High PTH may be seen with primary hyperparathyroidism, vitamin D deficiency, chronic kidney disease, low calcium, or secondary hyperparathyroidism.
No numeric scale available.
Parathyroid Hormone (Beckman)
Parathyroid hormone measured using the Beckman assay; used to evaluate calcium metabolism and parathyroid function.
Lower: 14Upper: 65Unit: pg/mL
Lower: Low values may suggest reduced parathyroid activity or suppression from high calcium, depending on calcium level and reference range.
Upper: High values may suggest primary hyperparathyroidism, vitamin D deficiency, kidney disease, low calcium, or secondary hyperparathyroidism.
No numeric scale available.
Bilirubin Total
Total bilirubin measures both conjugated and unconjugated bilirubin, a breakdown product of haemoglobin processed by the liver.
Upper: 21Unit: umol/l
Lower: Low bilirubin is usually not clinically significant.
Upper: High bilirubin may cause jaundice and may be seen with haemolysis, Gilbert syndrome, hepatitis, liver disease, or bile duct obstruction.
Bilirubin Conjugated
Conjugated bilirubin is bilirubin processed by the liver for excretion into bile.
Upper: 5Unit: umol/l
Lower: Low values are usually not clinically significant.
Upper: High values may suggest impaired bile flow, bile duct obstruction, hepatitis, liver injury, or inherited bilirubin handling disorders.
Bilirubin Unconj
Unconjugated bilirubin is bilirubin before liver processing and may rise with increased red-cell breakdown or reduced conjugation.
Upper: 18Unit: umol/l
Lower: Low values are usually not clinically significant.
Upper: High values may be seen with haemolysis, Gilbert syndrome, newborn jaundice, or impaired bilirubin conjugation.
Alkaline Phosphatase
Alkaline phosphatase is an enzyme found mainly in bile ducts, liver, bone, intestine, and placenta. It is used to assess liver-bile duct and bone conditions.
Lower: 35Upper: 105Unit: U/l
Lower: Low values are uncommon and may be seen with malnutrition, zinc deficiency, hypothyroidism, genetic causes, or lab variation.
Upper: High values may be seen with bile duct obstruction, liver disease, bone growth or turnover, vitamin D deficiency, pregnancy, or bone disorders.
Gamma GT
Gamma-glutamyl transferase is an enzyme associated with liver and bile duct function and is often used to help interpret alkaline phosphatase elevation.
Lower: 9Upper: 36Unit: U/l
Lower: Low GGT is usually not clinically significant.
Upper: High GGT may be seen with alcohol use, fatty liver disease, bile duct disease, medicines, liver inflammation, or enzyme induction.
ALT
Alanine aminotransferase is an enzyme found mainly in liver cells and is commonly used as a marker of liver cell injury.
Lower: 7Upper: 35Unit: U/l
Lower: Low values are usually not clinically significant on their own.
Upper: High values may suggest liver cell injury. Common causes include fatty liver disease, viral hepatitis, alcohol-related liver disease, medicines, toxins, or other liver disorders.
AST
Aspartate aminotransferase is an enzyme found in liver, muscle, heart, and other tissues. It is used as a non-specific marker of tissue injury.
Lower: 10Upper: 32Unit: U/l
Lower: Low values are usually not clinically significant on their own.
Upper: High values may be seen with liver injury, muscle injury, alcohol-related liver disease, haemolysis, strenuous exercise, or some cardiac conditions.
Amylase
Lower: 28Upper: 110Unit: U/l
No numeric scale available.
Liptase
Lipase is an enzyme produced mainly by the pancreas and helps digest fats. It is commonly used in evaluating pancreatitis.
Upper: 67Unit: U/l
Lower: Low lipase is usually not clinically significant, though very low levels may rarely be seen with pancreatic insufficiency.
Upper: High lipase may be seen with pancreatitis, pancreatic injury, kidney impairment, gallbladder disease, bowel disease, or some medicines.
CK
Creatine kinase is an enzyme found mainly in muscle and is used to assess muscle injury or breakdown.
Lower: 26Upper: 192Unit: U/l
Lower: Low CK is usually not clinically significant and may reflect low muscle mass or inactivity.
Upper: High CK may be seen with muscle injury, intense exercise, myositis, medicines such as statins, seizures, trauma, or rhabdomyolysis.
Total Protein
Total protein measures albumin plus globulins in blood and reflects hydration, liver function, immune proteins, and protein loss states.
Lower: 60Upper: 83Unit: g/l
Lower: Low total protein may be seen with malnutrition, liver disease, kidney or bowel protein loss, inflammation, or fluid overload.
Upper: High total protein may be seen with dehydration, chronic inflammation, infection, autoimmune disease, or monoclonal gammopathy.
Albumin
Albumin is the main protein in blood plasma and helps maintain fluid balance, transport substances, and reflect liver, kidney, nutritional, and inflammatory status.
Lower: 38Upper: 51Unit: g/l
Lower: Low albumin may be seen with inflammation, liver disease, kidney protein loss, malnutrition, bowel protein loss, severe illness, or fluid overload.
Upper: High albumin is uncommon and most often reflects dehydration or sample concentration.
Globulin
Globulin represents non-albumin blood proteins, including immunoglobulins and transport proteins.
Lower: 20Upper: 35Unit: g/l
Lower: Low globulin may be seen with immune deficiency, protein loss, malnutrition, or reduced antibody production.
Upper: High globulin may be seen with chronic inflammation, infection, autoimmune disease, liver disease, or monoclonal gammopathy.
Glycated HB (HbA1c)
HbA1c measures glycated haemoglobin and reflects average blood glucose over roughly the previous two to three months.
Lower: 3.9Upper: 6.1Unit: %
Lower: Low HbA1c may be seen with frequent low glucose, shortened red-cell lifespan, haemolysis, blood loss, or some treatments.
Upper: High HbA1c may suggest diabetes, prediabetes, or higher average glucose over time.
No numeric scale available.
Est Avg Glucose
Estimated average glucose is calculated from HbA1c and estimates average blood glucose over the previous two to three months.
Lower: 4.1Upper: 6.5Unit: mmol/l
Lower: Low estimated average glucose may reflect low HbA1c or frequent low glucose levels, but should be checked against actual glucose readings if symptoms occur.
Upper: High estimated average glucose reflects higher average blood sugar and may suggest diabetes, prediabetes, or suboptimal glucose control.
HbA1c (DCCT/NGSP)
HbA1c reported in DCCT/NGSP percentage units reflects average blood glucose over roughly the previous two to three months.
Lower: 4Upper: 6Unit: %
Lower: Low values may reflect frequent low glucose, shortened red-cell lifespan, haemolysis, blood loss, or treatment effects.
Upper: High values may suggest diabetes, prediabetes, or higher average blood glucose over time.
HbA1c (IFCC)
HbA1c reported in IFCC units reflects average blood glucose over roughly the previous two to three months.
Lower: 20Upper: 42Unit: mmol/mol
Lower: Low values may reflect frequent low glucose, shortened red-cell lifespan, haemolysis, blood loss, or treatment effects.
Upper: High values may suggest diabetes, prediabetes, or higher average blood glucose over time.
Insulin Fast (Beckman)
Fasting insulin measures insulin concentration after fasting and reflects how much insulin the pancreas is secreting in the fasting state.
Lower: 2.1Upper: 10.4Unit: mIU/L
Lower: Low fasting insulin may be seen with reduced insulin production, type 1 diabetes, pancreatic dysfunction, or low glucose states depending on context.
Upper: High fasting insulin may suggest hyperinsulinaemia and is commonly associated with insulin resistance, prediabetes, early type 2 diabetes, obesity, PCOS, or some medicines.
Iron
Serum iron measures circulating iron bound mainly to transferrin and is one part of iron studies.
Lower: 9Upper: 30.4Unit: umol/l
Lower: Low serum iron may be seen with iron deficiency, inflammation, chronic disease, or recent blood loss.
Upper: High serum iron may be seen with iron overload, recent iron intake, haemolysis, liver disease, or some anaemias.
No numeric scale available.
Transferrin
Transferrin is the main iron-transport protein in blood and is part of iron studies.
Lower: 2.5Upper: 3.8Unit: g/l
Lower: Low transferrin may be seen with inflammation, malnutrition, liver disease, nephrotic syndrome, or iron overload patterns.
Upper: High transferrin may be seen with iron deficiency, pregnancy, oestrogen use, or increased iron-binding capacity.
No numeric scale available.
Saturation
Transferrin saturation is the percentage of transferrin iron-binding sites occupied by iron and is part of iron studies.
Lower: 15Upper: 50Unit: %
Lower: Low saturation may suggest iron deficiency, inflammation-related iron restriction, or reduced circulating iron.
Upper: High saturation may suggest iron overload, recent iron intake, haemolysis, liver disease, or some anaemias.
No numeric scale available.
Ferritin
Ferritin is a protein that stores iron and is commonly used to assess body iron stores.
Lower: 10Upper: 120Unit: ng/ml
Lower: Low ferritin strongly suggests depleted iron stores and is commonly seen in iron deficiency, with or without anaemia.
Upper: High ferritin may be seen with inflammation, infection, liver disease, metabolic syndrome, kidney disease, malignancy, alcohol use, or iron overload.
Vitamin B12
Vitamin B12 is needed for nerve function, red blood cell production, and DNA synthesis.
Lower: 107Upper: 443Unit: pmol/l
Lower: Low B12 may cause or contribute to anaemia, neuropathy, cognitive symptoms, glossitis, or fatigue, and may result from diet, malabsorption, pernicious anaemia, or medicines.
Upper: High B12 is often due to supplementation, but can also be seen with liver disease, kidney disease, inflammation, or some blood disorders.
Urine Creatinine
Urine creatinine measures creatinine concentration or total excretion in urine and is often used to normalize other urine tests or assess 24-hour collection completeness.
Lower: 2.5Upper: 19.2Unit: mmol/l
Lower: Low urine creatinine may be seen with dilute urine, low muscle mass, incomplete collection, pregnancy, malnutrition, or reduced creatinine production.
Upper: High urine creatinine may be seen with concentrated urine, higher muscle mass, high meat intake, intense exercise, or increased muscle breakdown.
Urine Protein
Unit: mg/l
No numeric scale available.
Creatinine Excretion
Creatinine excretion measures how much creatinine is passed in urine over a defined period and helps assess collection completeness and muscle-mass-related excretion.
Lower: 5.3Upper: 15.9Unit: mmol/24h
Lower: Low excretion may suggest incomplete urine collection, low muscle mass, reduced production, or kidney impairment depending on context.
Upper: High excretion may be seen with higher muscle mass, high meat intake, intense exercise, or increased muscle breakdown.
No numeric scale available.
TSH
Thyroid-stimulating hormone is a pituitary hormone that regulates thyroid hormone production and is commonly used as a first-line thyroid function test.
Lower: 0.35Upper: 3.5Unit: mIU/l
Lower: Low TSH may suggest hyperthyroidism, thyroid hormone over-replacement, thyroiditis, pregnancy-related changes, pituitary disease, or non-thyroidal illness depending on free T4/T3.
Upper: High TSH may suggest hypothyroidism, under-replacement of thyroid hormone, recovery from illness, thyroiditis, or assay/medicine effects.
Free T4
Free T4 is the unbound form of thyroxine, a major thyroid hormone used to assess thyroid function.
Lower: 7.6Upper: 16.1Unit: pmol/l
Lower: Low free T4 may suggest hypothyroidism, pituitary disease, severe illness, or assay interference depending on TSH and context.
Upper: High free T4 may suggest hyperthyroidism, thyroiditis, excess thyroid hormone use, or assay interference.
Cortisol Morning
Lower: 185Upper: 624Unit: nmol/l
Free T3
Free T3 is the active thyroid hormone triiodothyronine circulating unbound in blood.
Lower: 4Upper: 7.4Unit: pmol/l
Lower: Low free T3 may be seen with hypothyroidism, severe illness, undernutrition, or non-thyroidal illness patterns.
Upper: High free T3 may be seen with hyperthyroidism, Graves disease, thyroiditis, or excess thyroid hormone use.
No numeric scale available.
Antithyroglobulin
Antithyroglobulin antibodies target thyroglobulin, a thyroid protein, and are used to assess autoimmune thyroid disease in selected contexts.
Upper: 20Unit: IU/ml
Lower: Low or negative values usually mean no significant thyroglobulin antibody was detected.
Upper: High values may be seen with autoimmune thyroiditis, Graves disease, or other thyroid inflammatory conditions.
No numeric scale available.
Antithyroid Perox
Thyroid peroxidase antibodies target an enzyme involved in thyroid hormone production and are commonly associated with autoimmune thyroid disease.
Upper: 35Unit: IU/ml
Lower: Low or negative values usually mean no significant thyroid peroxidase antibody was detected.
Upper: High values may be seen with Hashimoto thyroiditis, Graves disease, or increased risk of future thyroid dysfunction.
No numeric scale available.
TSH Receptor Ab
TSH receptor antibodies target the thyroid-stimulating hormone receptor and are mainly used in evaluating Graves disease.
Upper: 1.75Unit: IU/L
Lower: Low or negative values make TSH-receptor-antibody-mediated Graves disease less likely, but do not exclude all thyroid disease.
Upper: High values may support Graves disease and can sometimes be associated with thyroid eye disease or pregnancy-related fetal thyroid risk.
No numeric scale available.
HCG Quant
Quantitative hCG measures human chorionic gonadotropin, a hormone most commonly used in pregnancy assessment.
Upper: 5Unit: mIU/l
Lower: Low or undetectable levels usually suggest no pregnancy, very early pregnancy, or falling levels depending on timing.
Upper: High or rising levels are commonly seen in pregnancy but may also occur with trophoblastic disease or some tumours.
No numeric scale available.
FSH
Follicle-stimulating hormone is a pituitary hormone involved in ovarian follicle development, sperm production, and reproductive hormone regulation.
Lower: 3.5Upper: 135Unit: IU/l
Lower: Low FSH may be seen with pituitary or hypothalamic suppression, hormonal contraception, pregnancy, stress, undernutrition, or some endocrine disorders.
Upper: High FSH may be seen with menopause, primary ovarian insufficiency, reduced ovarian reserve, testicular failure, or gonadal damage.
LH
Unit: IU/l
No numeric scale available.
Prolactin
Lower: 3Upper: 27Unit: ug/l
No numeric scale available.
Total Testosterone
Total testosterone measures testosterone bound to proteins plus free testosterone and is used to assess androgen status.
Lower: 0.3Upper: 20Unit: nmol/l
Lower: Low total testosterone may be seen with hypogonadism, pituitary-gonadal disorders, chronic illness, high SHBG, obesity, medicines, or ageing.
Upper: High total testosterone may be seen with androgen use, PCOS, adrenal/gonadal androgen excess, low SHBG effects, or rarely tumours.
No numeric scale available.
SHBG
Sex hormone binding globulin binds testosterone and oestradiol and affects the amount of free or bioavailable sex hormone.
Lower: 18.2Upper: 135.5Unit: nmol/l
Lower: Low SHBG may be seen with insulin resistance, obesity, hypothyroidism, androgen excess, nephrotic syndrome, or some medicines.
Upper: High SHBG may be seen with hyperthyroidism, liver disease, oestrogen use, pregnancy, ageing, or some medicines.
No numeric scale available.
Free Tests Calc
Calculated free testosterone estimates the biologically available fraction of testosterone using total testosterone, SHBG, and albumin.
Lower: 6Upper: 55Unit: pmol/l
Lower: Low calculated free testosterone may be seen with hypogonadism, high SHBG, ageing, pituitary-gonadal disorders, chronic illness, or some medicines.
Upper: High calculated free testosterone may be seen with androgen excess, PCOS, androgen use, low SHBG, or androgen-producing tumours.
No numeric scale available.
DHEAS
DHEAS is an adrenal androgen precursor used to assess adrenal androgen production and causes of androgen excess.
Lower: 0.6Upper: 7.2Unit: umol/l
Lower: Low values may be seen with adrenal insufficiency, ageing, pituitary-adrenal suppression, or corticosteroid use, but may be non-specific.
Upper: High values may be seen with PCOS, adrenal hyperplasia, adrenal androgen excess, and rarely adrenal tumours.
25-OH Vitamin D
25-hydroxyvitamin D is the main blood test used to assess vitamin D stores, which are important for bone, muscle, calcium, and phosphate health.
Lower: 20Upper: 60Unit: ng/ml
Lower: Low levels may suggest vitamin D deficiency or insufficiency and can contribute to bone pain, muscle weakness, osteomalacia, or secondary hyperparathyroidism.
Upper: High levels are usually due to excessive supplementation and may increase the risk of high calcium, nausea, kidney stones, or kidney injury.
Urine PBG (Screen)
Urine porphobilinogen screening detects PBG, a haem pathway intermediate used to evaluate acute porphyria attacks.
Qualitative result
No numeric scale available.
Urine Urobilinogen
Urine urobilinogen is a bilirubin breakdown product that can reflect liver processing and intestinal bilirubin metabolism.
Qualitative result
No numeric scale available.
Urine Free Prophyrins
Urine free porphyrins measure porphyrin compounds related to haem synthesis and are used in evaluating porphyria patterns.
Lower: 20Upper: 320Unit: nmol/l
Lower: Low or normal values are generally expected and usually not clinically significant.
Upper: High values may be seen with porphyria, liver disease, lead exposure, some medicines, or secondary porphyrin changes.
No numeric scale available.
24h Urine Volume
Total amount of urine collected over a 24-hour period. It is used to assess fluid balance, kidney handling of water, and the reliability of some 24-hour urine measurements.
Unit: ml
Lower: Low volume may be seen with dehydration, reduced fluid intake, incomplete collection, or reduced urine production from kidney or circulatory problems.
Upper: High volume may be seen with high fluid intake, diuretic use, diabetes mellitus, diabetes insipidus, kidney concentrating problems, or some electrolyte disorders.
No numeric scale available.
Androstenedione
Androstenedione is an androgen precursor produced by the adrenal glands and gonads and is used in evaluating androgen excess or steroid hormone disorders.
Lower: 1Upper: 11.5Unit: nmol/l
Lower: Low values may be seen with reduced adrenal or gonadal hormone production, but are often not meaningful without symptoms and other hormone tests.
Upper: High values may be seen with PCOS, adrenal hyperplasia, adrenal or ovarian androgen excess, and rarely androgen-producing tumours.
No numeric scale available.
Copper Excretion
Copper excretion measures the amount of copper lost in urine over a defined period, commonly used in evaluating copper metabolism.
Lower: 3Upper: 35Unit: ug/24h
Lower: Low excretion may be seen with low copper intake, low body copper, incomplete collection, or reduced urinary excretion.
Upper: High excretion may be seen with Wilson disease, cholestatic liver disease, copper overload, inflammation, or after chelation therapy.
No numeric scale available.
Copper/Creatinine
Copper/creatinine ratio adjusts urine copper concentration for urine concentration using creatinine.
Lower: 1.6Upper: 62.8Unit: ug/g
Lower: Low ratios may reflect low copper excretion or sample/collection factors.
Upper: High ratios may suggest increased copper excretion, but may also be affected by low urine creatinine or concentrated samples.
No numeric scale available.
Cholesterol Total
Total cholesterol measures the combined cholesterol carried in all major lipoprotein particles.
Lower: 2.8Upper: 4.9Unit: mmol/l
Lower: Low levels are often not concerning but may be seen with malnutrition, hyperthyroidism, chronic illness, liver disease, or intensive lipid-lowering therapy.
Upper: High levels may increase cardiovascular risk, especially when LDL or non-HDL cholesterol are also high.
Triglycerides
Triglycerides are a type of blood fat used in cardiovascular and pancreatitis risk assessment.
Lower: 0.4Upper: 1.9Unit: mmol/l
Lower: Low triglycerides are usually not concerning and may reflect fasting, low-fat intake, or lipid-lowering therapy.
Upper: High triglycerides may be seen with insulin resistance, diabetes, alcohol use, obesity, hypothyroidism, kidney disease, medicines, or genetic lipid disorders.
HDL Cholesterol
HDL cholesterol is cholesterol carried by high-density lipoproteins and is part of cardiovascular risk assessment.
Lower: 1.2Upper: 2.4Unit: mmol/l
Lower: Low HDL may be associated with higher cardiovascular risk and can occur with insulin resistance, smoking, inactivity, obesity, or genetic factors.
Upper: High HDL is often associated with lower risk, but very high values are not always protective in every context.
LDL Cholesterol (Direct)
Direct LDL cholesterol measures cholesterol carried by low-density lipoproteins, a major contributor to atherosclerotic cardiovascular risk.
Upper: 3Unit: mmol/l
Lower: Low LDL is usually desirable, especially in people at increased cardiovascular risk, though very low values may reflect treatment or illness.
Upper: High LDL is associated with increased risk of atherosclerotic cardiovascular disease.
Non-HDL Cholesterol
Non-HDL cholesterol is total cholesterol minus HDL and represents cholesterol carried by atherogenic particles.
Lower: 0.9Upper: 3.7Unit: mmol/l
Lower: Low non-HDL cholesterol is generally favourable, especially in people at cardiovascular risk, though very low values may reflect treatment or illness.
Upper: High non-HDL cholesterol is associated with increased atherosclerotic cardiovascular risk.
Haemotology
30 items
No tests match this filter.
Test / Reference
Readings
Range graph
Haemoglobin
Haemoglobin is the oxygen-carrying protein in red blood cells and is used to assess anaemia or increased red-cell concentration.
Lower: 12Upper: 15Unit: g/dL
Lower: Low haemoglobin is anaemia and may be due to iron deficiency, B12 or folate deficiency, blood loss, inflammation, kidney disease, haemolysis, or marrow disorders.
Upper: High haemoglobin may be seen with dehydration, smoking, lung or heart disease, high altitude, testosterone use, sleep apnoea, or polycythaemia.
Red cell count
Red cell count measures the number of red blood cells in blood.
Lower: 3.8Upper: 4.8Unit: x10^12/L
Lower: Low red cell count may be seen with anaemia, blood loss, haemolysis, inflammation, kidney disease, or marrow disorders.
Upper: High red cell count may be seen with dehydration, smoking, lung or heart disease, high altitude, testosterone use, sleep apnoea, or polycythaemia.
Haemotocrit
Haematocrit is the proportion of blood volume made up by red blood cells.
Lower: 36Upper: 46Unit: %
Lower: Low haematocrit may be seen with anaemia, blood loss, haemolysis, inflammation, pregnancy, or fluid overload.
Upper: High haematocrit may be seen with dehydration, smoking, lung disease, high altitude, testosterone use, sleep apnoea, or polycythaemia.
MCV
Mean cell volume measures the average size of red blood cells.
Lower: 79.1Upper: 98.9Unit: fL
Lower: Low MCV may be seen with iron deficiency, thalassaemia trait, anaemia of chronic disease, or some inherited conditions.
Upper: High MCV may be seen with B12 or folate deficiency, alcohol use, liver disease, hypothyroidism, medicines, reticulocytosis, or marrow disorders.
MCH
Mean cell haemoglobin is the average amount of haemoglobin in each red blood cell.
Lower: 27Upper: 32Unit: pg
Lower: Low MCH may be seen with iron deficiency, thalassaemia trait, or other microcytic anaemias.
Upper: High MCH may be seen with macrocytosis, B12 or folate deficiency, liver disease, alcohol use, or some marrow disorders.
MCHC
Mean cell haemoglobin concentration measures the average haemoglobin concentration inside red blood cells.
Lower: 31Upper: 34.4Unit: g/dL
Lower: Low MCHC may be seen with iron deficiency or hypochromic anaemia.
Upper: High MCHC is uncommon and may be seen with spherocytosis, cold agglutinins, haemolysis, or laboratory artefact.
RDW
Red cell distribution width measures variation in red blood cell size.
Lower: 10Upper: 17.3Unit: %
Lower: Low RDW is usually not clinically significant.
Upper: High RDW may be seen with iron deficiency, B12 or folate deficiency, mixed anaemia, recent blood loss, haemolysis, or recovery after treatment.
White cell count
White cell count measures the total number of white blood cells and is used to assess infection, inflammation, immune status, and marrow activity.
Lower: 3.92Upper: 9.88Unit: x10^9/L
Lower: Low white cell count may increase infection risk and can be seen with viral infection, medicines, autoimmune disease, marrow disorders, chemotherapy, or nutritional deficiency.
Upper: High white cell count may be seen with infection, inflammation, stress, corticosteroids, smoking, trauma, pregnancy, or blood disorders.
Neutrophils
Neutrophils are white blood cells that provide rapid defence against bacterial and fungal infections.
Lower: 40Upper: 75Unit: %
Lower: Low neutrophils may increase infection risk and can occur with viral infection, medicines, autoimmune disease, marrow disorders, chemotherapy, or benign ethnic neutropenia.
Upper: High neutrophils may be seen with bacterial infection, inflammation, stress, corticosteroid use, smoking, trauma, or marrow disorders.
Neutrophils ABS
Absolute neutrophil count measures the number of neutrophils in the blood and is important for infection-risk assessment.
Lower: 2Upper: 7.5Unit: x10^9/L
Lower: Low absolute neutrophils may increase infection risk, especially when severe or persistent.
Upper: High absolute neutrophils may be seen with infection, inflammation, stress, corticosteroids, smoking, trauma, or haematological disorders.
Lymphocytes
Lymphocytes are white blood cells involved in viral immunity, antibody responses, and immune regulation.
Lower: 20Upper: 45Unit: %
Lower: Low lymphocytes may be seen with acute illness, corticosteroid use, immune deficiency, HIV, autoimmune disease, malnutrition, chemotherapy, or chronic illness.
Upper: High lymphocytes may be seen with viral infections, chronic inflammation, smoking, stress responses, or lymphoproliferative disorders.
Lymphocytes ABS
Absolute lymphocyte count measures the number of lymphocytes in the blood.
Lower: 1Upper: 4Unit: x10^9/L
Lower: Low absolute lymphocytes may suggest immune suppression, acute illness, corticosteroid effect, HIV, malnutrition, or medication effects.
Upper: High absolute lymphocytes may be seen with viral infection, chronic inflammation, smoking, or lymphoproliferative disorders.
Monocytes
Monocytes are white blood cells involved in immune defence, inflammation, and tissue cleanup.
Lower: 2Upper: 8Unit: %
Lower: Low monocytes are uncommon and usually not significant alone, but may occur with marrow suppression or severe illness.
Upper: High monocytes may be seen with chronic infection, inflammation, autoimmune disease, recovery from acute infection, stress, or some blood disorders.
Monocytes ABS
Absolute monocyte count measures the number of monocytes in the blood.
Lower: 0.18Upper: 1Unit: x10^9/L
Lower: Low absolute monocytes are uncommon and often not significant alone, but may occur with marrow suppression or severe illness.
Upper: High absolute monocytes may be seen with chronic inflammation, infection, autoimmune disease, recovery states, or haematological disorders.
Eosinophils
Eosinophils are white blood cells involved in allergic inflammation, parasite defence, drug reactions, and some immune disorders.
Lower: 1Upper: 4Unit: %
Lower: Low eosinophils are usually temporary and not clinically significant on their own. They may occur with acute stress, infection, high cortisol levels, or corticosteroid use.
Upper: High eosinophils may be seen with allergies, asthma, eczema, parasitic infection, drug reactions, autoimmune disease, adrenal insufficiency, or rarely blood and immune disorders.
Eosinophils ABS
Absolute eosinophil count measures the actual number of eosinophils in the blood.
Upper: 0.45Unit: x10^9/L
Lower: Low absolute eosinophils are usually not clinically significant and may be seen with stress, infection, or corticosteroid use.
Upper: High absolute eosinophils may be seen with allergy, asthma, eczema, parasitic infection, drug reaction, autoimmune disease, adrenal insufficiency, or rare haematological disorders.
Basophils
Basophils are white blood cells involved in allergic and inflammatory responses and are usually present in very small numbers.
Upper: 1Unit: %
Lower: Low basophils are usually not clinically significant.
Upper: High basophils may be seen with allergic inflammation, chronic inflammation, hypothyroidism, some infections, or rarely myeloproliferative disorders.
Basophils ABS
Absolute basophil count measures the number of basophils in the blood.
Upper: 0.2Unit: x10^9/L
Lower: Low absolute basophils are usually not clinically significant.
Upper: High absolute basophils may be seen with allergy, chronic inflammation, endocrine disorders, infection, or rarely bone marrow disorders.
Immature Gran
Immature granulocytes are early white blood cells released from bone marrow, often measured as part of a blood count differential.
Upper: 0.55Unit: %
Lower: Low or absent immature granulocytes are usually normal.
Upper: High values may be seen with infection, inflammation, marrow stress, severe illness, pregnancy, steroid use, or haematological disorders.
Immature Gran ABS
Absolute immature granulocyte count measures the number of immature granulocytes in blood.
Upper: 0.1Unit: x10^9/L
Lower: Low or absent values are usually normal.
Upper: High values may be seen with infection, inflammation, marrow stress, steroid use, severe illness, or haematological disorders.
Neut: Lymph ratio
The neutrophil-to-lymphocyte ratio compares neutrophil and lymphocyte counts and is a non-specific marker of immune or stress response.
Lower: 1Upper: 3Unit: Ratio
Lower: A low ratio may be seen with relatively low neutrophils or high lymphocytes, such as in some viral infections or immune patterns.
Upper: A high ratio may be seen with bacterial infection, inflammation, physiological stress, corticosteroid use, trauma, or severe illness.
Platelet Count
Platelet count measures the number of platelets, which are blood cells involved in clotting and bleeding control.
Lower: 150Upper: 450Unit: x10^9/L
Lower: Low platelets may increase bleeding risk and can occur with infection, medicines, immune thrombocytopenia, liver disease, marrow disorders, or consumption.
Upper: High platelets may be reactive from inflammation, infection, iron deficiency, surgery, or bleeding, or less commonly due to a marrow disorder.
MPV
Mean platelet volume measures the average size of platelets and may reflect platelet production or turnover.
Lower: 7.3Upper: 11.3Unit: fL
Lower: Low MPV may be seen with reduced platelet production or marrow-related causes, but is often non-specific.
Upper: High MPV may be seen with increased platelet turnover, inflammation, recovery from low platelets, or some platelet disorders.
ESR
Erythrocyte sedimentation rate is a non-specific marker that can rise with inflammation and some other conditions.
Upper: 20Unit: mm/hr
Lower: Low ESR is usually not clinically significant.
Upper: High ESR may be seen with infection, autoimmune disease, inflammation, anaemia, kidney disease, pregnancy, malignancy, or ageing.
Prothrombin Time
Prothrombin time measures clotting through the extrinsic and common pathways and is used to assess clotting function and warfarin effect.
Lower: 9.9Upper: 11.8Unit: seconds
Lower: A shortened PT is usually not clinically significant by itself.
Upper: A prolonged PT may be seen with warfarin, vitamin K deficiency, liver disease, clotting-factor deficiency, or consumptive coagulopathy.
No numeric scale available.
Control Time
Control time is a laboratory reference clotting time used for comparison with a patient clotting result.
Unit: seconds
Lower: Lower control values are generally a laboratory reference issue rather than a patient-specific clinical finding.
Upper: Higher control values are generally a laboratory reference issue rather than a patient-specific clinical finding.
No numeric scale available.
INR
INR standardises prothrombin time and is used to assess clotting, especially in people taking warfarin.
Lower: 0.8Upper: 1.2
Lower: A low INR may suggest relatively faster clotting or under-anticoagulation if the person is taking warfarin.
Upper: A high INR may suggest increased bleeding risk, liver synthetic dysfunction, vitamin K deficiency, warfarin effect, or other clotting-factor problems.
No numeric scale available.
PTT Patient
Partial thromboplastin time measures clotting through the intrinsic and common pathways and is used to assess bleeding risk, heparin effect, and clotting-factor problems.
Lower: 21.8Upper: 28Unit: seconds
Lower: A shortened PTT is often non-specific but may be seen with inflammation, high factor VIII, or sample issues.
Upper: A prolonged PTT may be seen with heparin, lupus anticoagulant, clotting-factor deficiency, inhibitors, liver disease, or consumptive coagulopathy.
No numeric scale available.
PTT Control
PTT control is a laboratory reference clotting time used to compare or validate the patient partial thromboplastin time result.
Lower: 25Upper: 35Unit: seconds
Lower: Lower control values are generally a laboratory reference issue rather than a patient-specific clinical finding.
Upper: Higher control values are generally a laboratory reference issue rather than a patient-specific clinical finding.
No numeric scale available.
XDP (D-dimer)
D-dimer is a breakdown product of cross-linked fibrin and reflects recent clot formation and breakdown.
Upper: 500Unit: ng/mL
Lower: Low D-dimer makes active significant clotting less likely in low-risk settings, depending on the clinical rule used.
Upper: High D-dimer may be seen with blood clots, infection, inflammation, surgery, trauma, pregnancy, cancer, liver disease, or increasing age.
Immunology
33 items
No tests match this filter.
Test / Reference
Readings
Range graph
Anti-Nuclear Ab
Antinuclear antibody testing detects antibodies that react with cell nuclei and is used as a screening test for some autoimmune connective tissue diseases.
Qualitative result
No numeric scale available.
ENA/CTD Screening
ENA/CTD screening looks for antibodies against extractable nuclear antigens associated with connective tissue diseases.
Upper: 0.6Unit: ratio
Lower: A negative screen makes some ENA-associated connective tissue diseases less likely, but does not exclude all autoimmune disease.
Upper: A positive screen may suggest antibodies associated with conditions such as Sjogren disease, lupus, systemic sclerosis, myositis, or mixed connective tissue disease.
No numeric scale available.
H pylori IgG
H. pylori IgG detects antibodies to Helicobacter pylori, a bacterium associated with gastritis and peptic ulcer disease.
Upper: 0.99Unit: U/mL
Lower: A negative result suggests no detectable prior immune response, but does not fully exclude current infection.
Upper: A positive result suggests previous exposure and may reflect current or past infection.
No numeric scale available.
Rapid Plasma Reagin
RPR is a non-treponemal blood test used to screen for and monitor syphilis activity.
Qualitative result
No numeric scale available.
TPHA
TPHA is a treponemal antibody test used to detect exposure to Treponema pallidum, the bacterium that causes syphilis.
Qualitative result
No numeric scale available.
T pallidum Screen Quant
A quantitative treponemal antibody screen measuring antibody response to Treponema pallidum, the bacterium that causes syphilis.
Upper: 0.99Unit: ratio
Lower: A negative result means treponemal antibodies were not detected, though very early infection may be missed.
Upper: A positive result suggests past or current syphilis infection and needs correlation with non-treponemal testing and clinical history.
No numeric scale available.
Gliadin IgA
Gliadin IgA detects antibodies to gliadin-related gluten proteins and may be used in coeliac disease evaluation, depending on assay type.
Upper: 6.9Unit: U/mL
Lower: A negative result makes gliadin IgA antibody reactivity less likely, but does not exclude coeliac disease by itself.
Upper: A positive result may be seen with coeliac disease or gluten-related immune reactivity, but specificity varies by assay.
Endomysium IgA
Endomysial IgA antibodies are highly specific antibodies used in the evaluation of coeliac disease.
Qualitative result
No numeric scale available.
T Transglutam IgA
Tissue transglutaminase IgA is an antibody test commonly used to screen for coeliac disease.
Upper: 6.9Unit: U/mL
Lower: A negative result makes active coeliac disease less likely, especially if total IgA is normal and gluten is being eaten.
Upper: A positive result supports coeliac disease in the right clinical context, especially at high levels.
NMDA
Detects antibodies against NMDA receptor, associated with anti-NMDA receptor encephalitis.
Qualitative result
No numeric scale available.
AMPA 1
Detects antibodies against AMPA receptor subtype 1, associated with autoimmune encephalitis.
Qualitative result
No numeric scale available.
AMPA 2
Detects antibodies against AMPA receptor subtype 2, associated with autoimmune encephalitis.
Qualitative result
No numeric scale available.
GABA-b-Recept
Detects antibodies against GABA-B receptor, associated with autoimmune encephalitis.
Qualitative result
No numeric scale available.
CASPR-2
Detects antibodies against CASPR2, associated with autoimmune encephalitis, neuromyotonia, Morvan syndrome, or related disorders.
Qualitative result
No numeric scale available.
LGI-1
Detects antibodies against LGI1, associated with autoimmune limbic encephalitis and faciobrachial dystonic seizures.
Qualitative result
No numeric scale available.
IgA
Immunoglobulin A is an antibody important in mucosal immunity, especially in the respiratory and gastrointestinal tracts.
Lower: 0.7Upper: 4Unit: g/l
Lower: Low IgA may increase infection risk in some people and can affect interpretation of IgA-based coeliac tests.
Upper: High IgA may be seen with chronic infection, inflammation, liver disease, autoimmune disease, or monoclonal gammopathy.
PR3 ELiA
PR3 ELiA detects antibodies to proteinase 3, one of the main ANCA-associated antibodies.
Qualitative result
No numeric scale available.
MPO ELiA
MPO ELiA detects antibodies to myeloperoxidase, one of the main ANCA-associated antibodies.
Qualitative result
No numeric scale available.
ANCA IIFT PATTERN
Reports the immunofluorescence pattern seen when testing for ANCA antibodies, used in the evaluation of some vasculitic and autoimmune disorders.
Qualitative result
No numeric scale available.
DPPX
Detects antibodies against DPPX, associated with autoimmune encephalitis and neurological syndromes.
Qualitative result
No numeric scale available.
AMPHIPHYSIN
Detects AMPHIPHYSIN antibodies, which may be associated with paraneoplastic autoimmune neurological syndromes.
Qualitative result
No numeric scale available.
CV2 (CRMP5)
Detects CV2 (CRMP5) antibodies, which may be associated with paraneoplastic autoimmune neurological syndromes.
Qualitative result
No numeric scale available.
Hu (ANNA-1)
Detects Hu (ANNA-1) antibodies, which may be associated with paraneoplastic autoimmune neurological syndromes.
Qualitative result
No numeric scale available.
ANTIBODY TITRE IIF
Measures the strength or dilution level of an antibody detected by indirect immunofluorescence.
Qualitative result
No numeric scale available.
PNMA2 (Ma/Ta)
Detects PNMA2 (Ma/Ta) antibodies, which may be associated with paraneoplastic autoimmune neurological syndromes.
Qualitative result
No numeric scale available.
Ri (ANNA-2)
Detects Ri (ANNA-2) antibodies, which may be associated with paraneoplastic autoimmune neurological syndromes.
Qualitative result
No numeric scale available.
Yo (PCA-1)
Detects Yo (PCA-1) antibodies, which may be associated with paraneoplastic autoimmune neurological syndromes.
Qualitative result
No numeric scale available.
RECOVERIN
Detects RECOVERIN antibodies, which may be associated with paraneoplastic autoimmune neurological syndromes.
Qualitative result
No numeric scale available.
SOX1
Detects SOX1 antibodies, which may be associated with paraneoplastic autoimmune neurological syndromes.
Qualitative result
No numeric scale available.
TITIN
Detects antibodies against titin, which may be associated with myasthenia gravis and thymoma in some contexts.
Qualitative result
No numeric scale available.
Zic4
Detects Zic4 antibodies, which may be associated with paraneoplastic autoimmune neurological syndromes.
Qualitative result
No numeric scale available.
GAD65
Detects antibodies against GAD65, associated with type 1 diabetes and some autoimmune neurological syndromes.
Qualitative result
No numeric scale available.
Tr(DNER)
Detects Tr(DNER) antibodies, which may be associated with paraneoplastic autoimmune neurological syndromes.
Qualitative result
No numeric scale available.
Molecular Biology
18 items
No tests match this filter.
Test / Reference
Readings
Range graph
Influenza B PCR
Detects genetic material or antigen from influenza B virus, depending on the test method and sample type.
Qualitative result
No numeric scale available.
Influenza A PCR
Detects genetic material or antigen from influenza A virus, depending on the test method and sample type.
Qualitative result
No numeric scale available.
RSV A/B PCR
Detects genetic material or antigen from respiratory syncytial virus types A and B, depending on the test method and sample type.
Qualitative result
No numeric scale available.
SARS-CoV-2
Detects genetic material or antigen from SARS-CoV-2, depending on the test method and sample type.
Qualitative result
No numeric scale available.
SYPHILIS ANTI T.PALLIDUM AB
Detects antibodies against Treponema pallidum, the bacterium that causes syphilis.
Qualitative result
No numeric scale available.
RUBELLA IgG antibodies
Rubella IgG antibodies assess immunity or previous exposure to rubella virus.
Qualitative result
No numeric scale available.
VARICELLA ELISA IgM
Varicella IgM by ELISA is used to assess possible recent varicella-zoster virus infection.
Qualitative result
No numeric scale available.
VARICELLA ELISA IgG
Varicella IgG by ELISA assesses immunity or previous exposure to varicella-zoster virus.
Qualitative result
No numeric scale available.
VARICELLA IgG
Varicella IgG assesses immunity or previous exposure to varicella-zoster virus.
Lower: 149.9Unit: mIU/mL
Lower: Low or negative values may suggest no detectable immunity and possible susceptibility to chickenpox.
Upper: Positive values usually suggest immunity from past infection or vaccination.
No numeric scale available.
HBs Ag
Hepatitis B surface antigen detects a protein from hepatitis B virus and is used to identify current HBV infection.
Qualitative result
No numeric scale available.
HEPATITIS C Virus Ab
Hepatitis C antibody testing detects immune exposure to hepatitis C virus.
Qualitative result
No numeric scale available.
Mycoplasma genitalium
Detects genetic material or antigen from Mycoplasma genitalium, depending on the test method and sample type.
Qualitative result
No numeric scale available.
Mycoplasma hominis
Detects genetic material or antigen from Mycoplasma hominis, depending on the test method and sample type.
Qualitative result
No numeric scale available.
Ureaplasma urealyticum
Detects genetic material or antigen from Ureaplasma urealyticum, depending on the test method and sample type.
Qualitative result
No numeric scale available.
Ureaplasma parvum
Detects genetic material or antigen from Ureaplasma parvum, depending on the test method and sample type.
Qualitative result
No numeric scale available.
Trichomonas vaginalis
Detects genetic material or antigen from Trichomonas vaginalis, depending on the test method and sample type.
Qualitative result
No numeric scale available.
Chlamydia trachomatis
Detects genetic material or antigen from Chlamydia trachomatis, depending on the test method and sample type.
Qualitative result
No numeric scale available.
Neisseria gonorrhoeae
Detects genetic material or antigen from Neisseria gonorrhoeae, depending on the test method and sample type.
This is an MRI from 2022, T2 sequence. Right in the area of the marginal and supramarginal gyrus, there is this area of atypical cortical architecture, which the radiologist interpreted as microgyria.
The same pathology is present on the 2024 MRI, now in T1 sequence. In this sequence, the difference is much clearer. Just look closely at the difference between the adjacent normal cortex and this area. In all other respects, the brain is clean. There aren't even foci of age-related vascular gliosis to latch onto, which is commendable, as by 30-40 years of age, people typically develop some small subcortical foci.
It's difficult now to assess the probability of this being a congenital or acquired condition, as it's impossible to know if they were present in her childhood.
Now, if we analyze your wife's symptoms in detail, her clinical presentation is very similar to the course of multiple sclerosis, with symptoms resembling relapses and remissions. Your wife's MRI is clean. Yes, there are cases where the MRI is clear at the very beginning (less than 1% of cases), and even those are explained by technical issues, lack of imaging of other areas like the spinal cord, or radiologist negligence regarding incidental and seemingly nonspecific foci. However, within 6 months to 1 year, visible lesions typically appear, even if the brain MRI was initially clear. In your wife's case, over almost 2 years, not a single lesion has appeared. Clinically it resembles MS, but the MRI picture is paradoxical. Even in primary progressive MS, lesions are visible in the spinal cord.
Regarding the spinal images, I'm not an expert and don't specialize much in paraspinal tissues like vertebral pathology or tissues adjacent to the spine. However, I am well-versed in the spinal cord. And I can say this: there are no lesions in your wife's spinal cord. I tried to spot any hyperintense areas, but they simply aren't there. Regarding spinal cord compression, yes, I agree. There is a protrusion into the spinal canal, but as you yourself understand, this DOES NOT explain the other symptoms at all.
Unfortunately, both in my case and in your wife's case, doctors have stopped the diagnostic search, which is disheartening. But still, after all these years, you haven't lost heart and are trying to find a logical explanation, which is good.
Leave a comment
Open Discussion
All comments are reviewed before being published. A wide range of opinions is allowed, as long as they are relevant and respectful.
ACTH
Chemistry
Legend
Lower limit
Upper limit
Reference range
Lower: 1.6
Upper: 13.9
Unit: pmol/l
Readings
2026-02-04: 2.92026-01-31: 2.9
Cortisol ODST
Chemistry
Details
Cortisol ODST
Upper: 50
Unit: nmol/L
Readings
2026-01-31: 18
S-Bicarbonate
Chemistry
Legend
Lower limit
Upper limit
Reference range
Serum bicarbonate reflects the main buffering base in blood and helps assess metabolic acid-base balance.
Lower: 21
Upper: 31
Unit: mmol/L
Lower: Low bicarbonate may be seen with metabolic acidosis, kidney disease, diarrhoea, lactic acidosis, ketoacidosis, or compensation for respiratory alkalosis.
Upper: High bicarbonate may be seen with metabolic alkalosis, vomiting, diuretics, mineralocorticoid excess, or compensation for chronic respiratory acidosis.
Notes: Interpret with pH or blood gas when available, PCO2, anion gap, electrolytes, kidney function, and clinical status.
Serum copper measures copper in blood, much of which is bound to caeruloplasmin, and is used to assess copper metabolism.
Lower: 12.6
Upper: 24.3
Unit: umol/L
Notes: Serum copper follows caeruloplasmin and inflammation. Interpret with caeruloplasmin, urine copper, liver tests, zinc exposure, and symptoms.
Readings
2022-12-01: 22.9
S-Caeruloplasmin
Chemistry
Details
S-Caeruloplasmin
Caeruloplasmin is a copper-carrying protein made by the liver and used in assessing copper metabolism and Wilson disease.
Lower: 25
Upper: 60
Unit: mg/dl
Notes: Caeruloplasmin is an acute-phase protein. Interpret with serum copper, urine copper, liver tests, inflammation, and clinical features.
Readings
2022-12-01: 31
Blood pH
Chemistry
Details
Blood pH
Blood pH measures the acidity or alkalinity of blood and is central to acid-base assessment.
Lower: 7.36
Upper: 7.44
Unit: pH
Notes: pH must be interpreted with PCO2, bicarbonate, anion gap, lactate, electrolytes, and the clinical condition.
Readings
2020-01-01: 7.49
Alpha-1-Globulin
Chemistry
Details
Alpha-1-Globulin
Alpha-1 globulins are blood proteins measured during serum protein electrophoresis and include proteins involved in inflammation and transport.
Lower: 2.1
Upper: 3.5
Unit: g/L
Notes: Electrophoresis fractions are pattern-based tests. Interpret with albumin, other globulin fractions, CRP, liver tests, and the full electrophoresis report.
Readings
2020-01-01: 2.8
Alpha-2-Globulin
Chemistry
Details
Alpha-2-Globulin
Alpha-2 globulins are blood proteins measured during serum protein electrophoresis and include inflammatory and transport proteins.
Lower: 5.1
Upper: 8.5
Unit: g/L
Notes: Interpret as part of the full protein electrophoresis pattern rather than as a standalone result.
Readings
2020-01-01: 7.9
Beta-Globulin
Chemistry
Details
Beta-Globulin
Beta globulins are proteins measured on serum protein electrophoresis and include transferrin, complement, and some immunoglobulins.
Lower: 6
Upper: 9.4
Unit: g/L
Notes: Interpret with the full electrophoresis pattern, immunoglobulins, iron studies, and paraprotein assessment.
Readings
2020-01-01: 9.1
Gamma-Globulin
Chemistry
Details
Gamma-Globulin
Gamma globulins are mainly immunoglobulins measured on serum protein electrophoresis and reflect antibody-related proteins.
Lower: 8
Upper: 13.5
Unit: g/L
Notes: A narrow spike and broad increase mean different things. Interpret with immunoglobulin levels, immunofixation, and the full electrophoresis report.
Readings
2020-01-01: 11.8
Paraprotein Concentration
Chemistry
Details
Paraprotein Concentration
Paraprotein concentration measures the amount of a monoclonal immunoglobulin protein detected in blood.
Notes: Interpret with immunofixation, serum free light chains, immunoglobulins, calcium, kidney function, haemoglobin, bone symptoms, and haematology review.
Readings
2020-01-01: Not detected
B-PCO₂
Chemistry
Details
B-PCO₂
Lower: 4.5
Upper: 6.1
Unit: kPa
Readings
2020-01-01: 4.1
B-PO₂
Chemistry
Details
B-PO₂
Lower: 11
Upper: 15
Unit: kPA
Readings
2020-01-01: 12.1
B-ACTUAL BICARBONATE
Chemistry
Details
B-ACTUAL BICARBONATE
Actual bicarbonate reflects the bicarbonate concentration in blood at the time of sampling and helps assess metabolic acid-base status.
Lower: 23
Upper: 27
Unit: mmol/l
Notes: Interpret with blood pH, PCO2, anion gap, electrolytes, kidney function, lactate, and clinical status.
Readings
2020-01-01: 23
B-STANDARD BICARBONATE
Chemistry
Details
B-STANDARD BICARBONATE
Standard bicarbonate estimates bicarbonate after adjusting for a standard carbon dioxide level, helping assess the metabolic component of acid-base balance.
Lower: 23
Upper: 27
Unit: mmol/l
Notes: Interpret with actual bicarbonate, pH, PCO2, anion gap, electrolytes, and clinical condition.
Readings
2020-01-01: 25
B-OXYGEN SATURATION
Chemistry
Details
B-OXYGEN SATURATION
Blood oxygen saturation estimates the percentage of haemoglobin carrying oxygen and reflects oxygenation at the time of sampling.
Lower: 95
Upper: 99
Unit: %
Notes: Interpret with PO2, haemoglobin, pulse oximetry, sample type, oxygen use, and symptoms.
Readings
2020-01-01: 97
Lipaemic
Chemistry
Details
Lipaemic
Lipaemic index reflects excess fat particles in the blood sample, which may interfere with some laboratory tests.
Notes: This is often a sample-quality/interference flag. If clinically relevant, interpret with fasting status and triglyceride level.
Urine copper measures copper eliminated in urine and is used in assessing copper metabolism and possible Wilson disease.
Lower: 5
Upper: 100
Unit: ug/L
Lower: Low urine copper may be seen with copper deficiency, low intake, incomplete collection, or low excretion states.
Upper: High urine copper may be seen with Wilson disease, liver disease, copper overload, inflammation, or chelation treatment.
Notes: A 24-hour collection is often preferred for interpretation. Results depend on collection accuracy and should be interpreted with caeruloplasmin and liver tests.
Readings
2022-12-01: 1402024-07-12: 12
CSF-Albumin
Chemistry
Details
CSF-Albumin
CSF albumin measures albumin in cerebrospinal fluid and is used to assess blood-brain barrier or blood-CSF barrier function.
Lower: 139
Upper: 246
Unit: mg/L
Notes: Interpret with serum albumin, CSF:serum albumin ratio, CSF cells, protein, IgG index, oligoclonal bands, and sample quality.
Readings
2022-12-01: 169
S-Albumin
Chemistry
Legend
Lower limit
Upper limit
Reference range
Serum albumin is the main blood plasma protein and reflects fluid balance, liver synthesis, protein loss, nutrition, and inflammation.
Lower: 34
Upper: 50
Unit: g/L
Lower: Low serum albumin may be seen with inflammation, liver disease, kidney protein loss, malnutrition, bowel protein loss, severe illness, or fluid overload.
Upper: High serum albumin is uncommon and most often reflects dehydration or sample concentration.
Notes: Interpret with total protein, globulin, liver tests, kidney tests, urine protein, CRP, and hydration status.
Readings
2026-07-27: 452022-12-01: 42.2
CSF-IgG
Chemistry
Details
CSF-IgG
CSF IgG measures immunoglobulin G in cerebrospinal fluid and helps assess immune activity within the central nervous system.
Lower: 20
Upper: 40
Unit: mg/L
Notes: Interpret with serum IgG, IgG index, oligoclonal bands, CSF cells, albumin ratio, and clinical picture.
Readings
2022-12-01: 20.2
S-IgG
Chemistry
Details
S-IgG
Serum IgG is the main immunoglobulin in blood and reflects part of the adaptive immune response.
Lower: 7
Upper: 16
Unit: g/L
Notes: Interpret with IgA, IgM, vaccine/infection history, electrophoresis, immunofixation, and clinical context.
Readings
2022-12-01: 11.7
CSF:Serum Alb Ratio
Chemistry
Details
CSF:Serum Alb Ratio
The CSF:serum albumin ratio compares albumin in cerebrospinal fluid and blood to assess blood-brain barrier integrity.
Upper: 8.9
Unit: mg/g
Notes: Age affects reference ranges. Interpret with CSF protein, cells, IgG index, oligoclonal bands, and sample quality.
Readings
2022-12-01: 4
IgG Index
Chemistry
Details
IgG Index
IgG index compares IgG levels in CSF and serum to assess possible antibody production within the central nervous system.
Lower: 0.34
Upper: 0.7
Notes: Interpret with oligoclonal bands, CSF cells, CSF protein, albumin ratio, MRI, and clinical findings.
Readings
2022-12-01: 0.43
Oligoclonal bands
Chemistry
Details
Oligoclonal bands
Oligoclonal bands are antibody bands detected in CSF and/or serum, used to assess immune activity within the central nervous system.
Notes: Pattern matters: CSF-only bands differ from matched serum/CSF bands. Interpret with MRI, CSF cells/protein, IgG index, and clinical syndrome.
Readings
2022-12-01: Negative
Macroscopic Appearance
Chemistry
Details
Macroscopic Appearance
Macroscopic appearance describes the visible colour and clarity of cerebrospinal fluid.
Notes: Interpret with CSF cell count, protein, glucose, cultures/PCR, xanthochromia testing, and collection details.
Readings
2022-12-01: Clear
Copper - DU
Chemistry
Details
Copper - DU
Copper-DU appears to refer to a copper measurement in a daily urine or duplicate urine context, used in assessing copper metabolism.
Lower: 40
Upper: 60
Unit: ug/24hr
Notes: The exact meaning depends on the laboratory method and units. Interpret with serum copper, caeruloplasmin, 24-hour urine copper, liver tests, and specialist advice.
Readings
2022-12-01: 190
Haemolysis
Chemistry
Details
Haemolysis
Haemolysis indicates red blood cell breakdown in the sample or in the body, depending on context.
Notes: Most reported haemolysis is sample-related. True in-body haemolysis needs correlation with haemoglobin, reticulocytes, LDH, bilirubin, and haptoglobin.
Plasma homocysteine is an amino-acid-related marker influenced by B vitamins, kidney function, genetics, and metabolic status.
Lower: 5
Upper: 15
Unit: umol/L
Notes: High homocysteine is a risk marker rather than a diagnosis. Interpret with B12, folate, methylmalonic acid where relevant, kidney function, and diet.
Readings
2020-01-01: 11.3
CRP
Chemistry
Legend
Lower limit
Upper limit
Reference range
C-reactive protein is a non-specific blood marker of inflammation produced by the liver.
Upper: 5
Unit: mg/L
Lower: Low CRP generally suggests no major systemic inflammatory response at the time of testing.
Upper: High CRP may be seen with infection, autoimmune inflammation, tissue injury, surgery, malignancy, or other inflammatory conditions.
Notes: CRP does not identify the cause of inflammation. Interpret with symptoms, ESR, white cell count, cultures or imaging where relevant, and trends over time.
Sodium is the main extracellular electrolyte and is essential for fluid balance, nerve function, and brain cell water balance.
Lower: 135
Upper: 145
Unit: mmol/L
Lower: Low sodium may be seen with excess water, diuretics, vomiting, diarrhoea, heart/liver/kidney disease, SIADH, adrenal insufficiency, or some medicines.
Upper: High sodium may be seen with dehydration, water loss, inadequate intake, diabetes insipidus, excessive salt intake, or impaired thirst/access to water.
Notes: The speed of change matters. Significant sodium abnormalities can be urgent and should be interpreted with fluid status, urine sodium/osmolality, glucose, kidney function, and medicines.
Potassium is an electrolyte essential for heart rhythm, nerve signalling, and muscle function.
Lower: 3.5
Upper: 5.1
Unit: mmol/L
Lower: Low potassium may be seen with vomiting, diarrhoea, diuretics, insulin shifts, poor intake, magnesium deficiency, or hormone disorders.
Upper: High potassium may be seen with kidney impairment, medicines, acidosis, cell breakdown, adrenal insufficiency, or sample haemolysis.
Notes: Abnormal potassium can be urgent, especially if marked or symptomatic. Interpret with kidney function, ECG, medicines, acid-base status, and sample quality.
Total CO2 mostly reflects bicarbonate in serum and is used as a marker of metabolic acid-base status.
Lower: 21
Upper: 31
Unit: mmol/L
Lower: Low total CO2 may suggest metabolic acidosis, kidney disease, diarrhoea, lactic acidosis, ketoacidosis, or compensation for respiratory alkalosis.
Upper: High total CO2 may suggest metabolic alkalosis, vomiting, diuretics, mineralocorticoid excess, or compensation for chronic respiratory acidosis.
Notes: Interpret with bicarbonate, anion gap, electrolytes, kidney function, blood gas if available, and clinical condition.
eGFR estimates kidney filtration rate from creatinine using the CKD-EPI equation and is used to assess kidney function.
Lower: 90
Upper: 120
Unit: mL/min
Lower: Low eGFR may suggest reduced kidney function, acute kidney injury, chronic kidney disease, dehydration, obstruction, or creatinine-related estimation effects.
Upper: High eGFR is often normal, especially in younger people, but may sometimes reflect hyperfiltration in diabetes, pregnancy, or high-flow kidney states.
Notes: eGFR is an estimate and is affected by creatinine, age, sex, muscle mass, diet, pregnancy, and acute illness. Trends and urine albumin/protein are important.
Total calcium measures calcium in blood, including protein-bound and free calcium, and is important for bone, nerve, muscle, and heart function.
Lower: 2.15
Upper: 2.5
Unit: mmol/l
Lower: Low total calcium may be seen with low albumin, vitamin D deficiency, hypoparathyroidism, kidney disease, magnesium deficiency, or acute illness.
Upper: High total calcium may be seen with hyperparathyroidism, malignancy, vitamin D excess, dehydration, medicines, or granulomatous disease.
Notes: Total calcium is affected by albumin. Interpret with adjusted or ionised calcium, PTH, phosphate, magnesium, vitamin D, and kidney function.
Readings
2024-07-11: 2.392025-02-25: 2.432026-01-31: 2.42
Calcium Albumin-Adjusted
Chemistry
Legend
Lower limit
Upper limit
Reference range
Albumin-adjusted calcium estimates calcium after correcting for albumin level, aiming to better reflect physiologically relevant calcium status.
Lower: 2.15
Upper: 2.5
Unit: mmol/l
Lower: Low adjusted calcium may suggest hypocalcaemia from vitamin D deficiency, hypoparathyroidism, kidney disease, magnesium deficiency, or other causes.
Upper: High adjusted calcium may suggest hypercalcaemia from hyperparathyroidism, malignancy, vitamin D excess, medicines, or other causes.
Notes: Ionised calcium is more direct when available. Interpret with albumin, phosphate, magnesium, PTH, vitamin D, kidney function, and symptoms.
Readings
2024-07-11: 2.332025-02-25: 2.332026-01-31: 2.38
Urate
Chemistry
Details
Urate
Urate is a breakdown product of purine metabolism and is used in assessing gout risk, kidney stones, and some metabolic states.
Lower: 0.16
Upper: 0.36
Unit: mmol/l
Notes: High urate alone does not diagnose gout. Interpret with symptoms, kidney function, medicines, diet, and history of stones or gout attacks.
Readings
2022-08-01: 0.26
Calcium Corrected(G)
Chemistry
Details
Calcium Corrected(G)
Corrected calcium is a calculated estimate of calcium adjusted for albumin level.
Lower: 2.15
Upper: 2.5
Unit: mmol/l
Notes: Correction formulas can be imperfect. Interpret with albumin, ionised calcium if available, PTH, phosphate, magnesium, vitamin D, and kidney function.
Readings
2022-08-01: 2.43
Magnesium
Chemistry
Legend
Lower limit
Upper limit
Reference range
Magnesium is an electrolyte important for nerve, muscle, heart rhythm, bone, and enzyme function.
Lower: 0.66
Upper: 1.07
Unit: mmol/l
Lower: Low magnesium may be seen with poor intake, diarrhoea, vomiting, diuretics, alcohol use, diabetes, kidney losses, or some medicines.
Upper: High magnesium may be seen with kidney impairment, excessive supplementation, magnesium-containing medicines, or severe illness.
Notes: Serum magnesium may not fully reflect body stores. Interpret with calcium, potassium, kidney function, medicines, and symptoms.
Phosphate is an electrolyte important for bone, energy metabolism, muscle, and cell function.
Lower: 0.78
Upper: 1.42
Unit: mmol/l
Lower: Low phosphate may be seen with refeeding, vitamin D deficiency, hyperparathyroidism, alcohol use, malnutrition, kidney losses, or some medicines.
Upper: High phosphate may be seen with kidney impairment, hypoparathyroidism, cell breakdown, acidosis, excessive intake, or sample haemolysis.
Notes: Interpret with calcium, PTH, vitamin D, kidney function, magnesium, diet, medicines, and clinical status.
Readings
2024-07-11: 1.272025-02-25: 0.922026-01-31: 1.1
Parathyroid Hormone
Chemistry
Details
Parathyroid Hormone
Parathyroid hormone regulates calcium and phosphate balance and is used to evaluate calcium disorders, vitamin D status, and parathyroid function.
Lower: 1.5
Upper: 6.9
Unit: pmol/L
Notes: Interpret with calcium, phosphate, magnesium, vitamin D, kidney function, and whether calcium is high, low, or normal.
Readings
2026-01-31: 8.2
Parathyroid Hormone (Beckman)
Chemistry
Details
Parathyroid Hormone (Beckman)
Parathyroid hormone measured using the Beckman assay; used to evaluate calcium metabolism and parathyroid function.
Lower: 14
Upper: 65
Unit: pg/mL
Notes: Assay-specific reference ranges matter. Interpret with calcium, phosphate, magnesium, vitamin D, kidney function, and symptoms.
Readings
2026-01-31: 77
Bilirubin Total
Chemistry
Legend
Lower limit
Upper limit
Reference range
Total bilirubin measures both conjugated and unconjugated bilirubin, a breakdown product of haemoglobin processed by the liver.
Upper: 21
Unit: umol/l
Lower: Low bilirubin is usually not clinically significant.
Upper: High bilirubin may cause jaundice and may be seen with haemolysis, Gilbert syndrome, hepatitis, liver disease, or bile duct obstruction.
Notes: Fractionated bilirubin helps separate liver/bile duct causes from red-cell breakdown or inherited causes.
Alkaline phosphatase is an enzyme found mainly in bile ducts, liver, bone, intestine, and placenta. It is used to assess liver-bile duct and bone conditions.
Lower: 35
Upper: 105
Unit: U/l
Lower: Low values are uncommon and may be seen with malnutrition, zinc deficiency, hypothyroidism, genetic causes, or lab variation.
Upper: High values may be seen with bile duct obstruction, liver disease, bone growth or turnover, vitamin D deficiency, pregnancy, or bone disorders.
Notes: Interpret with GGT, bilirubin, ALT, AST, calcium, phosphate, vitamin D, age, pregnancy status, and symptoms.
Gamma-glutamyl transferase is an enzyme associated with liver and bile duct function and is often used to help interpret alkaline phosphatase elevation.
Lower: 9
Upper: 36
Unit: U/l
Lower: Low GGT is usually not clinically significant.
Upper: High GGT may be seen with alcohol use, fatty liver disease, bile duct disease, medicines, liver inflammation, or enzyme induction.
Notes: GGT is sensitive but not specific. Interpret with ALT, AST, ALP, bilirubin, medicines, alcohol history, and metabolic risk factors.
Alanine aminotransferase is an enzyme found mainly in liver cells and is commonly used as a marker of liver cell injury.
Lower: 7
Upper: 35
Unit: U/l
Lower: Low values are usually not clinically significant on their own.
Upper: High values may suggest liver cell injury. Common causes include fatty liver disease, viral hepatitis, alcohol-related liver disease, medicines, toxins, or other liver disorders.
Notes: ALT does not identify the cause of liver injury. Interpret with AST, alkaline phosphatase, GGT, bilirubin, albumin, INR, medicines, alcohol history, and symptoms.
Aspartate aminotransferase is an enzyme found in liver, muscle, heart, and other tissues. It is used as a non-specific marker of tissue injury.
Lower: 10
Upper: 32
Unit: U/l
Lower: Low values are usually not clinically significant on their own.
Upper: High values may be seen with liver injury, muscle injury, alcohol-related liver disease, haemolysis, strenuous exercise, or some cardiac conditions.
Notes: AST is less liver-specific than ALT. Interpret with ALT, CK, GGT, bilirubin, medicines, alcohol history, exercise, and symptoms.
Lipase is an enzyme produced mainly by the pancreas and helps digest fats. It is commonly used in evaluating pancreatitis.
Upper: 67
Unit: U/l
Lower: Low lipase is usually not clinically significant, though very low levels may rarely be seen with pancreatic insufficiency.
Upper: High lipase may be seen with pancreatitis, pancreatic injury, kidney impairment, gallbladder disease, bowel disease, or some medicines.
Notes: The current label appears to say "Liptase", which may be a spelling variant or typo for lipase. Interpret with symptoms, imaging, and kidney function.
Readings
2025-02-25: 242026-01-31: 25
CK
Chemistry
Legend
Lower limit
Upper limit
Reference range
Creatine kinase is an enzyme found mainly in muscle and is used to assess muscle injury or breakdown.
Lower: 26
Upper: 192
Unit: U/l
Lower: Low CK is usually not clinically significant and may reflect low muscle mass or inactivity.
Upper: High CK may be seen with muscle injury, intense exercise, myositis, medicines such as statins, seizures, trauma, or rhabdomyolysis.
Notes: Interpret with symptoms, kidney function, urine findings, medicines, recent exercise, and whether the result is rising or falling.
Readings
2020-01-01: 642022-12-01: 802024-07-11: 87
Total Protein
Chemistry
Legend
Lower limit
Upper limit
Reference range
Total protein measures albumin plus globulins in blood and reflects hydration, liver function, immune proteins, and protein loss states.
Lower: 60
Upper: 83
Unit: g/l
Lower: Low total protein may be seen with malnutrition, liver disease, kidney or bowel protein loss, inflammation, or fluid overload.
Upper: High total protein may be seen with dehydration, chronic inflammation, infection, autoimmune disease, or monoclonal gammopathy.
Notes: Interpret with albumin, globulin, electrophoresis, kidney/liver tests, hydration status, and symptoms.
Albumin is the main protein in blood plasma and helps maintain fluid balance, transport substances, and reflect liver, kidney, nutritional, and inflammatory status.
Lower: 38
Upper: 51
Unit: g/l
Lower: Low albumin may be seen with inflammation, liver disease, kidney protein loss, malnutrition, bowel protein loss, severe illness, or fluid overload.
Upper: High albumin is uncommon and most often reflects dehydration or sample concentration.
Notes: Albumin is affected by inflammation and hydration. Interpret with total protein, globulin, liver tests, kidney tests, urine protein, and clinical context.
HbA1c measures glycated haemoglobin and reflects average blood glucose over roughly the previous two to three months.
Lower: 3.9
Upper: 6.1
Unit: %
Notes: HbA1c can be misleading with anaemia, haemoglobin variants, pregnancy, recent transfusion, kidney disease, or altered red-cell lifespan.
Readings
2021-10-01: 5.3
Est Avg Glucose
Chemistry
Legend
Lower limit
Upper limit
Reference range
Estimated average glucose is calculated from HbA1c and estimates average blood glucose over the previous two to three months.
Lower: 4.1
Upper: 6.5
Unit: mmol/l
Lower: Low estimated average glucose may reflect low HbA1c or frequent low glucose levels, but should be checked against actual glucose readings if symptoms occur.
Upper: High estimated average glucose reflects higher average blood sugar and may suggest diabetes, prediabetes, or suboptimal glucose control.
Notes: Because it is derived from HbA1c, it shares HbA1c limitations such as anaemia, haemoglobin variants, pregnancy, recent transfusion, and altered red-cell lifespan.
Readings
2026-04-29: 5.92021-10-01: 5.8
HbA1c (DCCT/NGSP)
Chemistry
Legend
Lower limit
Upper limit
Reference range
HbA1c reported in DCCT/NGSP percentage units reflects average blood glucose over roughly the previous two to three months.
Lower: 4
Upper: 6
Unit: %
Lower: Low values may reflect frequent low glucose, shortened red-cell lifespan, haemolysis, blood loss, or treatment effects.
Upper: High values may suggest diabetes, prediabetes, or higher average blood glucose over time.
Notes: Interpret with glucose readings and consider conditions that affect HbA1c accuracy, including anaemia, haemoglobin variants, pregnancy, transfusion, and kidney disease.
Readings
2024-07-11: 5.52026-01-31: 5.5
HbA1c (IFCC)
Chemistry
Legend
Lower limit
Upper limit
Reference range
HbA1c reported in IFCC units reflects average blood glucose over roughly the previous two to three months.
Lower: 20
Upper: 42
Unit: mmol/mol
Lower: Low values may reflect frequent low glucose, shortened red-cell lifespan, haemolysis, blood loss, or treatment effects.
Upper: High values may suggest diabetes, prediabetes, or higher average blood glucose over time.
Notes: IFCC and NGSP/DCCT are different reporting units for HbA1c. Interpretation depends on the reference range and clinical context.
Readings
2024-07-11: 372026-01-31: 37
Insulin Fast (Beckman)
Chemistry
Legend
Lower limit
Upper limit
Reference range
Fasting insulin measures insulin concentration after fasting and reflects how much insulin the pancreas is secreting in the fasting state.
Lower: 2.1
Upper: 10.4
Unit: mIU/L
Lower: Low fasting insulin may be seen with reduced insulin production, type 1 diabetes, pancreatic dysfunction, or low glucose states depending on context.
Upper: High fasting insulin may suggest hyperinsulinaemia and is commonly associated with insulin resistance, prediabetes, early type 2 diabetes, obesity, PCOS, or some medicines.
Notes: Insulin should be interpreted with fasting glucose, HbA1c, C-peptide where relevant, medicines, body composition, and whether the sample was truly fasting.
Readings
2026-04-29: 20.32026-01-31: 71.5
Iron
Chemistry
Details
Iron
Serum iron measures circulating iron bound mainly to transferrin and is one part of iron studies.
Lower: 9
Upper: 30.4
Unit: umol/l
Notes: Serum iron fluctuates during the day and is not interpreted alone. Use with ferritin, transferrin/TIBC, and transferrin saturation.
Readings
2022-09-09: 11.7
Transferrin
Chemistry
Details
Transferrin
Transferrin is the main iron-transport protein in blood and is part of iron studies.
Lower: 2.5
Upper: 3.8
Unit: g/l
Notes: Interpret with ferritin, serum iron, transferrin saturation, CRP, liver status, pregnancy status, and nutrition.
Readings
2022-09-09: 2.9
Saturation
Chemistry
Details
Saturation
Transferrin saturation is the percentage of transferrin iron-binding sites occupied by iron and is part of iron studies.
Lower: 15
Upper: 50
Unit: %
Notes: Interpret with ferritin, serum iron, transferrin/TIBC, CRP, liver tests, fasting status, and repeat testing if unexpected.
Readings
2022-09-13: 16
Ferritin
Chemistry
Legend
Lower limit
Upper limit
Reference range
Ferritin is a protein that stores iron and is commonly used to assess body iron stores.
Lower: 10
Upper: 120
Unit: ng/ml
Lower: Low ferritin strongly suggests depleted iron stores and is commonly seen in iron deficiency, with or without anaemia.
Upper: High ferritin may be seen with inflammation, infection, liver disease, metabolic syndrome, kidney disease, malignancy, alcohol use, or iron overload.
Notes: Ferritin is an acute-phase reactant, so it can rise during inflammation. Normal or high ferritin does not always exclude iron deficiency.
Readings
2022-09-13: 642022-10-11: 44
Vitamin B12
Chemistry
Legend
Lower limit
Upper limit
Reference range
Vitamin B12 is needed for nerve function, red blood cell production, and DNA synthesis.
Lower: 107
Upper: 443
Unit: pmol/l
Lower: Low B12 may cause or contribute to anaemia, neuropathy, cognitive symptoms, glossitis, or fatigue, and may result from diet, malabsorption, pernicious anaemia, or medicines.
Upper: High B12 is often due to supplementation, but can also be seen with liver disease, kidney disease, inflammation, or some blood disorders.
Notes: Serum B12 can be misleading. Borderline results may need methylmalonic acid, homocysteine, intrinsic factor antibodies, and clinical correlation.
Urine creatinine measures creatinine concentration or total excretion in urine and is often used to normalize other urine tests or assess 24-hour collection completeness.
Lower: 2.5
Upper: 19.2
Unit: mmol/l
Lower: Low urine creatinine may be seen with dilute urine, low muscle mass, incomplete collection, pregnancy, malnutrition, or reduced creatinine production.
Upper: High urine creatinine may be seen with concentrated urine, higher muscle mass, high meat intake, intense exercise, or increased muscle breakdown.
Notes: Urine creatinine alone gives limited kidney-function information. Interpret with serum creatinine, eGFR, urine volume, collection timing, and the test it is correcting.
Creatinine excretion measures how much creatinine is passed in urine over a defined period and helps assess collection completeness and muscle-mass-related excretion.
Lower: 5.3
Upper: 15.9
Unit: mmol/24h
Notes: Often used to judge whether a 24-hour urine collection is complete. Interpret with urine volume, serum creatinine, and body size.
Readings
2024-07-12: 13.2
TSH
Chemistry
Legend
Lower limit
Upper limit
Reference range
Thyroid-stimulating hormone is a pituitary hormone that regulates thyroid hormone production and is commonly used as a first-line thyroid function test.
Lower: 0.35
Upper: 3.5
Unit: mIU/l
Lower: Low TSH may suggest hyperthyroidism, thyroid hormone over-replacement, thyroiditis, pregnancy-related changes, pituitary disease, or non-thyroidal illness depending on free T4/T3.
Upper: High TSH may suggest hypothyroidism, under-replacement of thyroid hormone, recovery from illness, thyroiditis, or assay/medicine effects.
Notes: Interpret with free T4 and sometimes free T3. Biotin, thyroid medicines, pregnancy, pituitary disease, and acute illness can affect interpretation.
Free T4 is the unbound form of thyroxine, a major thyroid hormone used to assess thyroid function.
Lower: 7.6
Upper: 16.1
Unit: pmol/l
Lower: Low free T4 may suggest hypothyroidism, pituitary disease, severe illness, or assay interference depending on TSH and context.
Upper: High free T4 may suggest hyperthyroidism, thyroiditis, excess thyroid hormone use, or assay interference.
Notes: Interpret with TSH, symptoms, medicines such as biotin or thyroid hormone, pregnancy status, and clinical context.
Readings
2023-08-29: 12.42026-01-31: 10.5
Cortisol Morning
Chemistry
Legend
Lower limit
Upper limit
Reference range
Lower: 185
Upper: 624
Unit: nmol/l
Readings
2026-02-04: 3422026-01-31: 303
Free T3
Chemistry
Details
Free T3
Free T3 is the active thyroid hormone triiodothyronine circulating unbound in blood.
Lower: 4
Upper: 7.4
Unit: pmol/l
Notes: Free T3 is usually interpreted with TSH and free T4. It is not always needed for routine thyroid screening.
Readings
2023-08-29: 5.5
Antithyroglobulin
Chemistry
Details
Antithyroglobulin
Antithyroglobulin antibodies target thyroglobulin, a thyroid protein, and are used to assess autoimmune thyroid disease in selected contexts.
Upper: 20
Unit: IU/ml
Notes: Interpret with TSH, free T4, thyroid peroxidase antibodies, thyroid history, and whether thyroglobulin monitoring is being used.
Readings
2023-08-29: 15
Antithyroid Perox
Chemistry
Details
Antithyroid Perox
Thyroid peroxidase antibodies target an enzyme involved in thyroid hormone production and are commonly associated with autoimmune thyroid disease.
Upper: 35
Unit: IU/ml
Notes: Antibody positivity can occur before abnormal thyroid hormone levels. Interpret with TSH and free T4.
Readings
2023-08-29: 1
TSH Receptor Ab
Chemistry
Details
TSH Receptor Ab
TSH receptor antibodies target the thyroid-stimulating hormone receptor and are mainly used in evaluating Graves disease.
Upper: 1.75
Unit: IU/L
Notes: Interpret with TSH, free T4/T3, thyroid imaging where relevant, pregnancy status, and clinical features.
Readings
2023-08-29: 0.9
HCG Quant
Chemistry
Details
HCG Quant
Quantitative hCG measures human chorionic gonadotropin, a hormone most commonly used in pregnancy assessment.
Upper: 5
Unit: mIU/l
Notes: Serial measurements and ultrasound are often more informative than a single value when evaluating early pregnancy or pregnancy complications.
Readings
2021-04-01: 0.6
FSH
Chemistry
Legend
Lower limit
Upper limit
Reference range
Follicle-stimulating hormone is a pituitary hormone involved in ovarian follicle development, sperm production, and reproductive hormone regulation.
Lower: 3.5
Upper: 135
Unit: IU/l
Lower: Low FSH may be seen with pituitary or hypothalamic suppression, hormonal contraception, pregnancy, stress, undernutrition, or some endocrine disorders.
Upper: High FSH may be seen with menopause, primary ovarian insufficiency, reduced ovarian reserve, testicular failure, or gonadal damage.
Notes: Interpret with age, sex, menstrual status, cycle day, LH, estradiol, testosterone, pregnancy status, and medicines.
Readings
2022-08-01: 28.32026-01-31: 43.7
LH
Chemistry
Details
LH
Unit: IU/l
Readings
2026-01-31: 44.3
Prolactin
Chemistry
Details
Prolactin
Lower: 3
Upper: 27
Unit: ug/l
Readings
2026-01-31: 7
Total Testosterone
Chemistry
Details
Total Testosterone
Total testosterone measures testosterone bound to proteins plus free testosterone and is used to assess androgen status.
Lower: 0.3
Upper: 20
Unit: nmol/l
Notes: Morning sampling is often preferred in men. Interpret with SHBG, calculated free testosterone, LH/FSH, symptoms, age, sex, and medicines.
Readings
2022-08-01: 2
SHBG
Chemistry
Details
SHBG
Sex hormone binding globulin binds testosterone and oestradiol and affects the amount of free or bioavailable sex hormone.
Lower: 18.2
Upper: 135.5
Unit: nmol/l
Notes: SHBG changes interpretation of total testosterone. Interpret with total and calculated free testosterone, albumin, symptoms, and hormone context.
Readings
2022-08-01: 43.2
Free Tests Calc
Chemistry
Details
Free Tests Calc
Calculated free testosterone estimates the biologically available fraction of testosterone using total testosterone, SHBG, and albumin.
Lower: 6
Upper: 55
Unit: pmol/l
Notes: Interpret with total testosterone, SHBG, albumin, symptoms, age, sex, timing of sample, and assay method.
Readings
2022-08-01: 30.6
DHEAS
Chemistry
Legend
Lower limit
Upper limit
Reference range
DHEAS is an adrenal androgen precursor used to assess adrenal androgen production and causes of androgen excess.
Lower: 0.6
Upper: 7.2
Unit: umol/l
Lower: Low values may be seen with adrenal insufficiency, ageing, pituitary-adrenal suppression, or corticosteroid use, but may be non-specific.
Upper: High values may be seen with PCOS, adrenal hyperplasia, adrenal androgen excess, and rarely adrenal tumours.
Notes: Interpret with age, sex, symptoms, testosterone, androstenedione, 17-hydroxyprogesterone, cortisol testing where relevant, and medicines.
Readings
2022-08-01: 5.32026-01-31: 3.5
25-OH Vitamin D
Chemistry
Legend
Lower limit
Upper limit
Reference range
25-hydroxyvitamin D is the main blood test used to assess vitamin D stores, which are important for bone, muscle, calcium, and phosphate health.
Lower: 20
Upper: 60
Unit: ng/ml
Lower: Low levels may suggest vitamin D deficiency or insufficiency and can contribute to bone pain, muscle weakness, osteomalacia, or secondary hyperparathyroidism.
Upper: High levels are usually due to excessive supplementation and may increase the risk of high calcium, nausea, kidney stones, or kidney injury.
Notes: Interpret with calcium, phosphate, parathyroid hormone, kidney function, diet, sun exposure, and supplement use.
Readings
2022-09-13: 37.92026-01-31: 31.9
Urine PBG (Screen)
Chemistry
Details
Urine PBG (Screen)
Urine porphobilinogen screening detects PBG, a haem pathway intermediate used to evaluate acute porphyria attacks.
Notes: Timing matters: testing is most useful during symptoms. Interpret with urine ALA, porphyrins, creatinine correction, medicines, and specialist guidance.
Readings
2024-07-11: Negative
Urine Urobilinogen
Chemistry
Details
Urine Urobilinogen
Urine urobilinogen is a bilirubin breakdown product that can reflect liver processing and intestinal bilirubin metabolism.
Notes: Interpret with urine bilirubin, serum bilirubin fractions, liver tests, haemolysis markers, and symptoms.
Readings
2024-07-11: Normal
Urine Free Prophyrins
Chemistry
Details
Urine Free Prophyrins
Urine free porphyrins measure porphyrin compounds related to haem synthesis and are used in evaluating porphyria patterns.
Lower: 20
Upper: 320
Unit: nmol/l
Notes: The label appears to say "Prophyrins", likely referring to porphyrins. Porphyria interpretation depends on the specific porphyrin pattern and symptoms.
Readings
2024-07-11: 20
24h Urine Volume
Chemistry
Details
24h Urine Volume
Total amount of urine collected over a 24-hour period. It is used to assess fluid balance, kidney handling of water, and the reliability of some 24-hour urine measurements.
Unit: ml
Notes: Interpret alongside fluid intake, medicines, kidney function, glucose, electrolytes, and whether the 24-hour collection was complete.
Readings
2024-07-12: 2740
Androstenedione
Chemistry
Details
Androstenedione
Androstenedione is an androgen precursor produced by the adrenal glands and gonads and is used in evaluating androgen excess or steroid hormone disorders.
Lower: 1
Upper: 11.5
Unit: nmol/l
Notes: Interpret with testosterone, DHEAS, 17-hydroxyprogesterone, menstrual history, symptoms, age, medicines, and assay method.
Readings
2022-08-01: 4.9
Copper Excretion
Chemistry
Details
Copper Excretion
Copper excretion measures the amount of copper lost in urine over a defined period, commonly used in evaluating copper metabolism.
Lower: 3
Upper: 35
Unit: ug/24h
Notes: Interpret with collection completeness, urine volume, serum copper, caeruloplasmin, liver tests, medicines, and clinical features.
Readings
2024-07-12: 33
Copper/Creatinine
Chemistry
Details
Copper/Creatinine
Copper/creatinine ratio adjusts urine copper concentration for urine concentration using creatinine.
Lower: 1.6
Upper: 62.8
Unit: ug/g
Notes: Ratios are useful for spot samples but can be misleading when creatinine excretion is abnormal. Interpret with 24-hour copper where available.
Readings
2024-07-12: 22.1
Cholesterol Total
Chemistry
Legend
Lower limit
Upper limit
Reference range
Total cholesterol measures the combined cholesterol carried in all major lipoprotein particles.
Lower: 2.8
Upper: 4.9
Unit: mmol/l
Lower: Low levels are often not concerning but may be seen with malnutrition, hyperthyroidism, chronic illness, liver disease, or intensive lipid-lowering therapy.
Upper: High levels may increase cardiovascular risk, especially when LDL or non-HDL cholesterol are also high.
Notes: Cardiovascular risk depends on the full lipid profile, age, blood pressure, diabetes, smoking, family history, and existing vascular disease.
Readings
2025-02-25: 5.32026-01-31: 4.8
Triglycerides
Chemistry
Legend
Lower limit
Upper limit
Reference range
Triglycerides are a type of blood fat used in cardiovascular and pancreatitis risk assessment.
Lower: 0.4
Upper: 1.9
Unit: mmol/l
Lower: Low triglycerides are usually not concerning and may reflect fasting, low-fat intake, or lipid-lowering therapy.
Upper: High triglycerides may be seen with insulin resistance, diabetes, alcohol use, obesity, hypothyroidism, kidney disease, medicines, or genetic lipid disorders.
Notes: Very high triglycerides can increase pancreatitis risk. Interpret with fasting status, HDL, non-HDL cholesterol, glucose/HbA1c, TSH, medicines, and alcohol intake.
Readings
2025-02-25: 1.52026-01-31: 1.6
HDL Cholesterol
Chemistry
Legend
Lower limit
Upper limit
Reference range
HDL cholesterol is cholesterol carried by high-density lipoproteins and is part of cardiovascular risk assessment.
Lower: 1.2
Upper: 2.4
Unit: mmol/l
Lower: Low HDL may be associated with higher cardiovascular risk and can occur with insulin resistance, smoking, inactivity, obesity, or genetic factors.
Upper: High HDL is often associated with lower risk, but very high values are not always protective in every context.
Notes: Do not interpret HDL alone. Overall risk depends on LDL, non-HDL cholesterol, triglycerides, blood pressure, diabetes, smoking, and history.
Readings
2025-02-25: 1.32026-01-31: 1.1
LDL Cholesterol (Direct)
Chemistry
Legend
Lower limit
Upper limit
Reference range
Direct LDL cholesterol measures cholesterol carried by low-density lipoproteins, a major contributor to atherosclerotic cardiovascular risk.
Upper: 3
Unit: mmol/l
Lower: Low LDL is usually desirable, especially in people at increased cardiovascular risk, though very low values may reflect treatment or illness.
Upper: High LDL is associated with increased risk of atherosclerotic cardiovascular disease.
Notes: Treatment decisions depend on overall risk, existing cardiovascular disease, diabetes, kidney disease, family history, and guideline targets.
Readings
2025-02-25: 3.22026-01-31: 3.5
Non-HDL Cholesterol
Chemistry
Legend
Lower limit
Upper limit
Reference range
Non-HDL cholesterol is total cholesterol minus HDL and represents cholesterol carried by atherogenic particles.
Lower: 0.9
Upper: 3.7
Unit: mmol/l
Lower: Low non-HDL cholesterol is generally favourable, especially in people at cardiovascular risk, though very low values may reflect treatment or illness.
Upper: High non-HDL cholesterol is associated with increased atherosclerotic cardiovascular risk.
Notes: Non-HDL is useful when triglycerides are elevated. Interpret with LDL, HDL, triglycerides, and overall cardiovascular risk.
Readings
2025-02-25: 42026-01-31: 3.7
Haemoglobin
Haemotology
Legend
Lower limit
Upper limit
Reference range
Haemoglobin is the oxygen-carrying protein in red blood cells and is used to assess anaemia or increased red-cell concentration.
Lower: 12
Upper: 15
Unit: g/dL
Lower: Low haemoglobin is anaemia and may be due to iron deficiency, B12 or folate deficiency, blood loss, inflammation, kidney disease, haemolysis, or marrow disorders.
Upper: High haemoglobin may be seen with dehydration, smoking, lung or heart disease, high altitude, testosterone use, sleep apnoea, or polycythaemia.
Notes: Interpret with haematocrit, red cell count, MCV, RDW, ferritin, B12/folate, kidney function, oxygen status, and symptoms.
Red cell count measures the number of red blood cells in blood.
Lower: 3.8
Upper: 4.8
Unit: x10^12/L
Lower: Low red cell count may be seen with anaemia, blood loss, haemolysis, inflammation, kidney disease, or marrow disorders.
Upper: High red cell count may be seen with dehydration, smoking, lung or heart disease, high altitude, testosterone use, sleep apnoea, or polycythaemia.
Notes: Interpret with haemoglobin, haematocrit, MCV, iron studies, oxygen status, and symptoms.
Mean cell volume measures the average size of red blood cells.
Lower: 79.1
Upper: 98.9
Unit: fL
Lower: Low MCV may be seen with iron deficiency, thalassaemia trait, anaemia of chronic disease, or some inherited conditions.
Upper: High MCV may be seen with B12 or folate deficiency, alcohol use, liver disease, hypothyroidism, medicines, reticulocytosis, or marrow disorders.
Notes: Interpret with haemoglobin, RDW, MCH, ferritin, B12, folate, liver tests, TSH, and medication history.
White cell count measures the total number of white blood cells and is used to assess infection, inflammation, immune status, and marrow activity.
Lower: 3.92
Upper: 9.88
Unit: x10^9/L
Lower: Low white cell count may increase infection risk and can be seen with viral infection, medicines, autoimmune disease, marrow disorders, chemotherapy, or nutritional deficiency.
Upper: High white cell count may be seen with infection, inflammation, stress, corticosteroids, smoking, trauma, pregnancy, or blood disorders.
Notes: Interpret with the differential count, symptoms, medicines, blood film if available, and whether the abnormality is persistent or changing.
Neutrophils are white blood cells that provide rapid defence against bacterial and fungal infections.
Lower: 40
Upper: 75
Unit: %
Lower: Low neutrophils may increase infection risk and can occur with viral infection, medicines, autoimmune disease, marrow disorders, chemotherapy, or benign ethnic neutropenia.
Upper: High neutrophils may be seen with bacterial infection, inflammation, stress, corticosteroid use, smoking, trauma, or marrow disorders.
Notes: Absolute neutrophil count is more important than percentage. Severity and persistence determine significance.
Lymphocytes are white blood cells involved in viral immunity, antibody responses, and immune regulation.
Lower: 20
Upper: 45
Unit: %
Lower: Low lymphocytes may be seen with acute illness, corticosteroid use, immune deficiency, HIV, autoimmune disease, malnutrition, chemotherapy, or chronic illness.
Upper: High lymphocytes may be seen with viral infections, chronic inflammation, smoking, stress responses, or lymphoproliferative disorders.
Notes: Interpret with absolute lymphocyte count, total white cell count, smear findings if available, symptoms, and persistence.
Monocytes are white blood cells involved in immune defence, inflammation, and tissue cleanup.
Lower: 2
Upper: 8
Unit: %
Lower: Low monocytes are uncommon and usually not significant alone, but may occur with marrow suppression or severe illness.
Upper: High monocytes may be seen with chronic infection, inflammation, autoimmune disease, recovery from acute infection, stress, or some blood disorders.
Notes: Use absolute monocyte count and persistence over time rather than percentage alone.
Eosinophils are white blood cells involved in allergic inflammation, parasite defence, drug reactions, and some immune disorders.
Lower: 1
Upper: 4
Unit: %
Lower: Low eosinophils are usually temporary and not clinically significant on their own. They may occur with acute stress, infection, high cortisol levels, or corticosteroid use.
Upper: High eosinophils may be seen with allergies, asthma, eczema, parasitic infection, drug reactions, autoimmune disease, adrenal insufficiency, or rarely blood and immune disorders.
Notes: Severity, persistence, symptoms, travel, medicines, and organ involvement matter. Absolute eosinophil count is usually more useful than percentage.
Absolute eosinophil count measures the actual number of eosinophils in the blood.
Upper: 0.45
Unit: x10^9/L
Lower: Low absolute eosinophils are usually not clinically significant and may be seen with stress, infection, or corticosteroid use.
Upper: High absolute eosinophils may be seen with allergy, asthma, eczema, parasitic infection, drug reaction, autoimmune disease, adrenal insufficiency, or rare haematological disorders.
Notes: Persistent or marked eosinophilia needs context and sometimes further evaluation for organ involvement or secondary causes.
Basophils are white blood cells involved in allergic and inflammatory responses and are usually present in very small numbers.
Upper: 1
Unit: %
Lower: Low basophils are usually not clinically significant.
Upper: High basophils may be seen with allergic inflammation, chronic inflammation, hypothyroidism, some infections, or rarely myeloproliferative disorders.
Notes: Small percentage changes can look dramatic because basophil counts are normally low. Absolute count is often more useful.
Platelet count measures the number of platelets, which are blood cells involved in clotting and bleeding control.
Lower: 150
Upper: 450
Unit: x10^9/L
Lower: Low platelets may increase bleeding risk and can occur with infection, medicines, immune thrombocytopenia, liver disease, marrow disorders, or consumption.
Upper: High platelets may be reactive from inflammation, infection, iron deficiency, surgery, or bleeding, or less commonly due to a marrow disorder.
Notes: Interpret with blood film, haemoglobin, white cell count, bleeding/clotting symptoms, ferritin, CRP, and persistence over time.
Prothrombin time measures clotting through the extrinsic and common pathways and is used to assess clotting function and warfarin effect.
Lower: 9.9
Upper: 11.8
Unit: seconds
Notes: Interpret with INR, PTT, platelet count, liver tests, medicines, bleeding history, and clinical context.
Readings
2022-12-01: 9.6
Control Time
Haemotology
Details
Control Time
Control time is a laboratory reference clotting time used for comparison with a patient clotting result.
Unit: seconds
Notes: This result is mainly used by the laboratory to calculate or validate clotting tests. It is not usually interpreted clinically on its own.
Readings
2022-12-01: 10.7
INR
Haemotology
Details
INR
INR standardises prothrombin time and is used to assess clotting, especially in people taking warfarin.
Lower: 0.8
Upper: 1.2
Notes: Target INR depends on indication. Interpret with medicines, liver function, bleeding/thrombotic history, and prothrombin time.
Readings
2022-12-01: 1
PTT Patient
Haemotology
Details
PTT Patient
Partial thromboplastin time measures clotting through the intrinsic and common pathways and is used to assess bleeding risk, heparin effect, and clotting-factor problems.
Lower: 21.8
Upper: 28
Unit: seconds
Notes: Interpret with PT/INR, platelet count, fibrinogen, medicines, bleeding/thrombosis history, and mixing studies when needed.
Readings
2022-12-01: 21.9
PTT Control
Haemotology
Details
PTT Control
PTT control is a laboratory reference clotting time used to compare or validate the patient partial thromboplastin time result.
Lower: 25
Upper: 35
Unit: seconds
Notes: This value is mainly technical. The patient PTT/APTT and clinical context are what matter clinically.
Readings
2022-12-01: 26.6
XDP (D-dimer)
Haemotology
Legend
Lower limit
Upper limit
Reference range
D-dimer is a breakdown product of cross-linked fibrin and reflects recent clot formation and breakdown.
Upper: 500
Unit: ng/mL
Lower: Low D-dimer makes active significant clotting less likely in low-risk settings, depending on the clinical rule used.
Upper: High D-dimer may be seen with blood clots, infection, inflammation, surgery, trauma, pregnancy, cancer, liver disease, or increasing age.
Notes: D-dimer is sensitive but not specific. It should be interpreted with clinical probability and is not diagnostic of thrombosis by itself.
Readings
2020-01-01: 3662021-10-01: 384
Anti-Nuclear Ab
Immunology
Details
Anti-Nuclear Ab
Antinuclear antibody testing detects antibodies that react with cell nuclei and is used as a screening test for some autoimmune connective tissue diseases.
Notes: ANA is not diagnostic by itself. Pattern, titre, ENA/dsDNA results, symptoms, and clinical context determine significance.
Readings
2022-10-01: Negative2024-07-01: Negative
ENA/CTD Screening
Immunology
Details
ENA/CTD Screening
ENA/CTD screening looks for antibodies against extractable nuclear antigens associated with connective tissue diseases.
Upper: 0.6
Unit: ratio
Notes: Specific antibody identity matters more than the screening result alone. Interpret with ANA, symptoms, and confirmatory antibody testing.
Readings
2022-10-01: 0.1
H pylori IgG
Immunology
Details
H pylori IgG
H. pylori IgG detects antibodies to Helicobacter pylori, a bacterium associated with gastritis and peptic ulcer disease.
Upper: 0.99
Unit: U/mL
Notes: IgG can remain positive after eradication. Stool antigen, breath testing, or biopsy are better for confirming active infection.
Readings
2022-10-01: 0.89
Rapid Plasma Reagin
Immunology
Details
Rapid Plasma Reagin
RPR is a non-treponemal blood test used to screen for and monitor syphilis activity.
Notes: Interpret with treponemal tests, titre, symptoms, treatment history, pregnancy status, and exposure timing.
Readings
2023-08-01: Negative
TPHA
Immunology
Details
TPHA
TPHA is a treponemal antibody test used to detect exposure to Treponema pallidum, the bacterium that causes syphilis.
Notes: Treponemal tests can remain positive for life. Interpret with RPR/VDRL, titre, symptoms, exposure, and treatment history.
Readings
2023-08-01: Negative
T pallidum Screen Quant
Immunology
Details
T pallidum Screen Quant
A quantitative treponemal antibody screen measuring antibody response to Treponema pallidum, the bacterium that causes syphilis.
Upper: 0.99
Unit: ratio
Notes: Treponemal tests often remain positive after treatment. RPR/VDRL titres are used to assess activity and treatment response.
Readings
2023-08-01: 0.12
Gliadin IgA
Immunology
Legend
Lower limit
Upper limit
Reference range
Gliadin IgA detects antibodies to gliadin-related gluten proteins and may be used in coeliac disease evaluation, depending on assay type.
Upper: 6.9
Unit: U/mL
Lower: A negative result makes gliadin IgA antibody reactivity less likely, but does not exclude coeliac disease by itself.
Upper: A positive result may be seen with coeliac disease or gluten-related immune reactivity, but specificity varies by assay.
Notes: Tissue transglutaminase IgA and endomysial IgA are generally more specific. Interpret with total IgA and whether gluten is being eaten.
Readings
2024-07-01: 1.32026-01-31: 1.6
Endomysium IgA
Immunology
Details
Endomysium IgA
Endomysial IgA antibodies are highly specific antibodies used in the evaluation of coeliac disease.
Notes: Testing may be falsely negative with IgA deficiency or if the person is already avoiding gluten. Interpret with tissue transglutaminase IgA and total IgA.
Readings
2024-07-01: Negative2026-01-31: Negative
T Transglutam IgA
Immunology
Legend
Lower limit
Upper limit
Reference range
Tissue transglutaminase IgA is an antibody test commonly used to screen for coeliac disease.
Upper: 6.9
Unit: U/mL
Lower: A negative result makes active coeliac disease less likely, especially if total IgA is normal and gluten is being eaten.
Upper: A positive result supports coeliac disease in the right clinical context, especially at high levels.
Notes: False negatives can occur with IgA deficiency or gluten avoidance. Interpret with total IgA, endomysial IgA, symptoms, diet, and biopsy decisions.
Readings
2024-07-01: 0.42026-01-31: 0.5
NMDA
Immunology
Details
NMDA
Detects antibodies against NMDA receptor, associated with anti-NMDA receptor encephalitis.
Notes: Interpret with symptoms, titre, sample type, CSF/MRI/EEG findings, other antibodies, and specialist review. Low-positive results can be non-specific.
Readings
2022-12-01: Negative2024-07-01: Negative
AMPA 1
Immunology
Details
AMPA 1
Detects antibodies against AMPA receptor subtype 1, associated with autoimmune encephalitis.
Notes: Interpret with symptoms, titre, sample type, CSF/MRI/EEG findings, other antibodies, and specialist review. Low-positive results can be non-specific.
Readings
2022-12-01: Negative2024-07-01: Negative
AMPA 2
Immunology
Details
AMPA 2
Detects antibodies against AMPA receptor subtype 2, associated with autoimmune encephalitis.
Notes: Interpret with symptoms, titre, sample type, CSF/MRI/EEG findings, other antibodies, and specialist review. Low-positive results can be non-specific.
Readings
2022-12-01: Negative2024-07-01: Negative
GABA-b-Recept
Immunology
Details
GABA-b-Recept
Detects antibodies against GABA-B receptor, associated with autoimmune encephalitis.
Notes: Interpret with symptoms, titre, sample type, CSF/MRI/EEG findings, other antibodies, and specialist review. Low-positive results can be non-specific.
Readings
2022-12-01: Negative2024-07-01: Negative
CASPR-2
Immunology
Details
CASPR-2
Detects antibodies against CASPR2, associated with autoimmune encephalitis, neuromyotonia, Morvan syndrome, or related disorders.
Notes: Interpret with symptoms, titre, sample type, CSF/MRI/EEG findings, other antibodies, and specialist review. Low-positive results can be non-specific.
Readings
2022-12-01: Negative2024-07-01: Negative
LGI-1
Immunology
Details
LGI-1
Detects antibodies against LGI1, associated with autoimmune limbic encephalitis and faciobrachial dystonic seizures.
Notes: Interpret with symptoms, titre, sample type, CSF/MRI/EEG findings, other antibodies, and specialist review. Low-positive results can be non-specific.
Readings
2022-12-01: Negative2024-07-01: Negative
IgA
Immunology
Legend
Lower limit
Upper limit
Reference range
Immunoglobulin A is an antibody important in mucosal immunity, especially in the respiratory and gastrointestinal tracts.
Lower: 0.7
Upper: 4
Unit: g/l
Lower: Low IgA may increase infection risk in some people and can affect interpretation of IgA-based coeliac tests.
Upper: High IgA may be seen with chronic infection, inflammation, liver disease, autoimmune disease, or monoclonal gammopathy.
Notes: Interpret with IgG, IgM, serum electrophoresis, infection history, autoimmune symptoms, and coeliac testing context.
Readings
2024-07-01: 3.62026-01-31: 2.65
PR3 ELiA
Immunology
Details
PR3 ELiA
PR3 ELiA detects antibodies to proteinase 3, one of the main ANCA-associated antibodies.
Notes: Interpret with MPO, ANCA pattern, kidney and respiratory findings, urinalysis, inflammatory markers, symptoms, and specialist assessment.
Readings
2022-12-01: Negative
MPO ELiA
Immunology
Details
MPO ELiA
MPO ELiA detects antibodies to myeloperoxidase, one of the main ANCA-associated antibodies.
Notes: Interpret with PR3, ANCA pattern, kidney findings, urinalysis, inflammatory markers, symptoms, and specialist assessment.
Readings
2022-12-01: Negative
ANCA IIFT PATTERN
Immunology
Details
ANCA IIFT PATTERN
Reports the immunofluorescence pattern seen when testing for ANCA antibodies, used in the evaluation of some vasculitic and autoimmune disorders.
Notes: Interpret with MPO and PR3 antibody results, kidney findings, urinalysis, inflammatory markers, symptoms, and clinical probability.
Readings
2022-12-01: Negative
DPPX
Immunology
Details
DPPX
Detects antibodies against DPPX, associated with autoimmune encephalitis and neurological syndromes.
Notes: Interpret with symptoms, titre, sample type, CSF/MRI/EEG findings, other antibodies, and specialist review. Low-positive results can be non-specific.
Readings
2022-12-01: Negative
AMPHIPHYSIN
Immunology
Details
AMPHIPHYSIN
Detects AMPHIPHYSIN antibodies, which may be associated with paraneoplastic autoimmune neurological syndromes.
Notes: Interpret with the neurological syndrome, cancer risk and screening, imaging, CSF findings, other antibodies, and specialist review.
Readings
2022-12-01: Negative
CV2 (CRMP5)
Immunology
Details
CV2 (CRMP5)
Detects CV2 (CRMP5) antibodies, which may be associated with paraneoplastic autoimmune neurological syndromes.
Notes: Interpret with the neurological syndrome, cancer risk and screening, imaging, CSF findings, other antibodies, and specialist review.
Readings
2022-12-01: Negative
Hu (ANNA-1)
Immunology
Details
Hu (ANNA-1)
Detects Hu (ANNA-1) antibodies, which may be associated with paraneoplastic autoimmune neurological syndromes.
Notes: Interpret with the neurological syndrome, cancer risk and screening, imaging, CSF findings, other antibodies, and specialist review.
Readings
2022-12-01: Negative
ANTIBODY TITRE IIF
Immunology
Details
ANTIBODY TITRE IIF
Measures the strength or dilution level of an antibody detected by indirect immunofluorescence.
Notes: Titre alone does not diagnose disease. Pattern, antigen specificity, symptoms, and confirmatory testing are important.
Readings
2022-12-01: Negative
PNMA2 (Ma/Ta)
Immunology
Details
PNMA2 (Ma/Ta)
Detects PNMA2 (Ma/Ta) antibodies, which may be associated with paraneoplastic autoimmune neurological syndromes.
Notes: Interpret with the neurological syndrome, cancer risk and screening, imaging, CSF findings, other antibodies, and specialist review.
Readings
2022-12-01: Negative
Ri (ANNA-2)
Immunology
Details
Ri (ANNA-2)
Detects Ri (ANNA-2) antibodies, which may be associated with paraneoplastic autoimmune neurological syndromes.
Notes: Interpret with the neurological syndrome, cancer risk and screening, imaging, CSF findings, other antibodies, and specialist review.
Readings
2022-12-01: Negative
Yo (PCA-1)
Immunology
Details
Yo (PCA-1)
Detects Yo (PCA-1) antibodies, which may be associated with paraneoplastic autoimmune neurological syndromes.
Notes: Interpret with the neurological syndrome, cancer risk and screening, imaging, CSF findings, other antibodies, and specialist review.
Readings
2022-12-01: Negative
RECOVERIN
Immunology
Details
RECOVERIN
Detects RECOVERIN antibodies, which may be associated with paraneoplastic autoimmune neurological syndromes.
Notes: Interpret with the neurological syndrome, cancer risk and screening, imaging, CSF findings, other antibodies, and specialist review.
Readings
2022-12-01: Negative
SOX1
Immunology
Details
SOX1
Detects SOX1 antibodies, which may be associated with paraneoplastic autoimmune neurological syndromes.
Notes: Interpret with the neurological syndrome, cancer risk and screening, imaging, CSF findings, other antibodies, and specialist review.
Readings
2022-12-01: Negative
TITIN
Immunology
Details
TITIN
Detects antibodies against titin, which may be associated with myasthenia gravis and thymoma in some contexts.
Notes: Interpret with AChR/MuSK antibodies, neuromuscular symptoms, EMG, imaging, age, and specialist review.
Readings
2022-12-01: Negative
Zic4
Immunology
Details
Zic4
Detects Zic4 antibodies, which may be associated with paraneoplastic autoimmune neurological syndromes.
Notes: Interpret with the neurological syndrome, cancer risk and screening, imaging, CSF findings, other antibodies, and specialist review.
Readings
2022-12-01: Negative
GAD65
Immunology
Details
GAD65
Detects antibodies against GAD65, associated with type 1 diabetes and some autoimmune neurological syndromes.
Notes: Interpret with symptoms, titre, sample type, CSF/MRI/EEG findings, other antibodies, and specialist review. Low-positive results can be non-specific.
Readings
2022-12-01: Negative
Tr(DNER)
Immunology
Details
Tr(DNER)
Detects Tr(DNER) antibodies, which may be associated with paraneoplastic autoimmune neurological syndromes.
Notes: Interpret with the neurological syndrome, cancer risk and screening, imaging, CSF findings, other antibodies, and specialist review.
Readings
2022-12-01: Negative
Influenza B PCR
Molecular Biology
Details
Influenza B PCR
Detects genetic material or antigen from influenza B virus, depending on the test method and sample type.
Notes: Interpret with symptoms, exposure timing, sample site, prior treatment, and local clinical guidance.
Readings
2022-09-01: Negative
Influenza A PCR
Molecular Biology
Details
Influenza A PCR
Detects genetic material or antigen from influenza A virus, depending on the test method and sample type.
Notes: Interpret with symptoms, exposure timing, sample site, prior treatment, and local clinical guidance.
Readings
2022-09-01: Negative
RSV A/B PCR
Molecular Biology
Details
RSV A/B PCR
Detects genetic material or antigen from respiratory syncytial virus types A and B, depending on the test method and sample type.
Notes: Interpret with symptoms, exposure timing, sample site, prior treatment, and local clinical guidance.
Readings
2022-09-01: Negative
SARS-CoV-2
Molecular Biology
Details
SARS-CoV-2
Detects genetic material or antigen from SARS-CoV-2, depending on the test method and sample type.
Notes: Interpret with symptoms, exposure timing, sample site, prior treatment, and local clinical guidance.
Readings
2020-01-01: Negative2021-10-01: Negative
SYPHILIS ANTI T.PALLIDUM AB
Molecular Biology
Details
SYPHILIS ANTI T.PALLIDUM AB
Detects antibodies against Treponema pallidum, the bacterium that causes syphilis.
Notes: Treponemal antibodies can remain positive after treated infection. Interpret with RPR/VDRL titre, symptoms, exposure, and treatment history.
Readings
2021-10-01: Negative
RUBELLA IgG antibodies
Molecular Biology
Details
RUBELLA IgG antibodies
Rubella IgG antibodies assess immunity or previous exposure to rubella virus.
Notes: Interpret with vaccination history, pregnancy status, exposure timing, and IgM testing if recent infection is suspected.
Readings
2021-10-01: 41.2
VARICELLA ELISA IgM
Molecular Biology
Details
VARICELLA ELISA IgM
Varicella IgM by ELISA is used to assess possible recent varicella-zoster virus infection.
Notes: Interpret with symptoms, rash timing, exposure, IgG status, PCR if available, and clinical context.
Readings
2021-10-01: Negative
VARICELLA ELISA IgG
Molecular Biology
Details
VARICELLA ELISA IgG
Varicella IgG by ELISA assesses immunity or previous exposure to varicella-zoster virus.
Notes: Interpret with vaccination history, immune status, pregnancy status, exposure timing, and local thresholds.
Readings
2021-10-01: Positive
VARICELLA IgG
Molecular Biology
Details
VARICELLA IgG
Varicella IgG assesses immunity or previous exposure to varicella-zoster virus.
Lower: 149.9
Unit: mIU/mL
Notes: Interpret with vaccination history, pregnancy status, immune status, and exposure risk.
Readings
2021-10-01: 1700
HBs Ag
Molecular Biology
Details
HBs Ag
Hepatitis B surface antigen detects a protein from hepatitis B virus and is used to identify current HBV infection.
Notes: Interpret with anti-HBs, anti-HBc IgM/IgG, HBV DNA, liver tests, vaccination history, and exposure timing.
Readings
2021-10-01: Negative
HEPATITIS C Virus Ab
Molecular Biology
Details
HEPATITIS C Virus Ab
Hepatitis C antibody testing detects immune exposure to hepatitis C virus.
Notes: Antibodies can remain positive after cleared or treated infection. HCV RNA is needed to confirm current infection.
Readings
2021-10-01: Negative
Mycoplasma genitalium
Molecular Biology
Details
Mycoplasma genitalium
Detects genetic material or antigen from Mycoplasma genitalium, depending on the test method and sample type.
Notes: Interpret with symptoms, exposure timing, sample site, prior treatment, and local clinical guidance.
Readings
2021-10-01: Negative
Mycoplasma hominis
Molecular Biology
Details
Mycoplasma hominis
Detects genetic material or antigen from Mycoplasma hominis, depending on the test method and sample type.
Notes: Interpret with symptoms, exposure timing, sample site, prior treatment, and local clinical guidance.
Readings
2021-10-01: Negative
Ureaplasma urealyticum
Molecular Biology
Details
Ureaplasma urealyticum
Detects genetic material or antigen from Ureaplasma urealyticum, depending on the test method and sample type.
Notes: Interpret with symptoms, exposure timing, sample site, prior treatment, and local clinical guidance.
Readings
2021-10-01: Positive
Ureaplasma parvum
Molecular Biology
Details
Ureaplasma parvum
Detects genetic material or antigen from Ureaplasma parvum, depending on the test method and sample type.
Notes: Interpret with symptoms, exposure timing, sample site, prior treatment, and local clinical guidance.
Readings
2021-10-01: Negative
Trichomonas vaginalis
Molecular Biology
Details
Trichomonas vaginalis
Detects genetic material or antigen from Trichomonas vaginalis, depending on the test method and sample type.
Notes: Interpret with symptoms, exposure timing, sample site, prior treatment, and local clinical guidance.
Readings
2021-10-01: Negative
Chlamydia trachomatis
Molecular Biology
Details
Chlamydia trachomatis
Detects genetic material or antigen from Chlamydia trachomatis, depending on the test method and sample type.
Notes: Interpret with symptoms, exposure timing, sample site, prior treatment, and local clinical guidance.
Readings
2021-10-01: Negative
Neisseria gonorrhoeae
Molecular Biology
Details
Neisseria gonorrhoeae
Detects genetic material or antigen from Neisseria gonorrhoeae, depending on the test method and sample type.
Notes: Interpret with symptoms, exposure timing, sample site, prior treatment, and local clinical guidance.
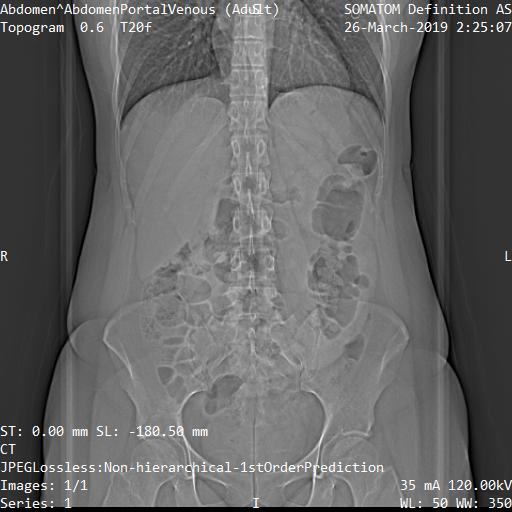

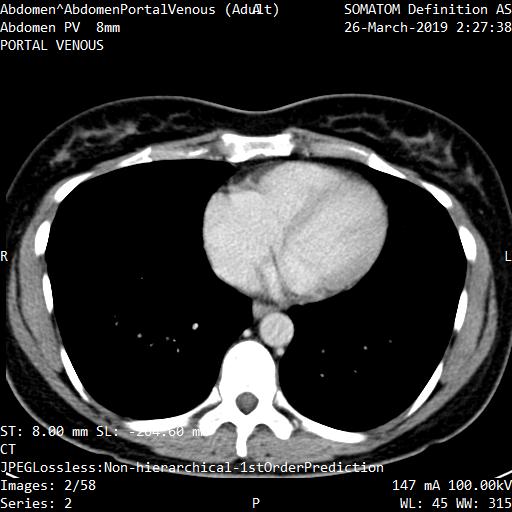

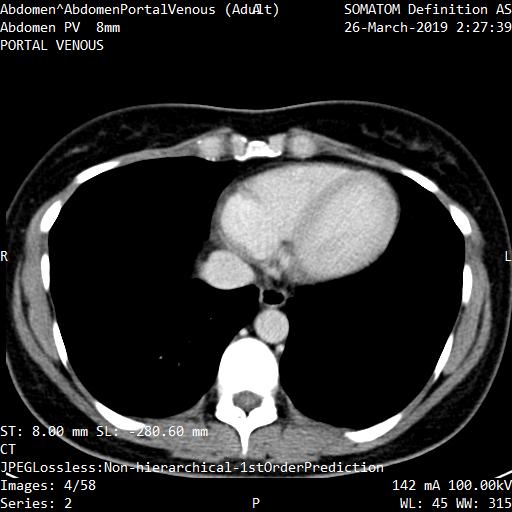
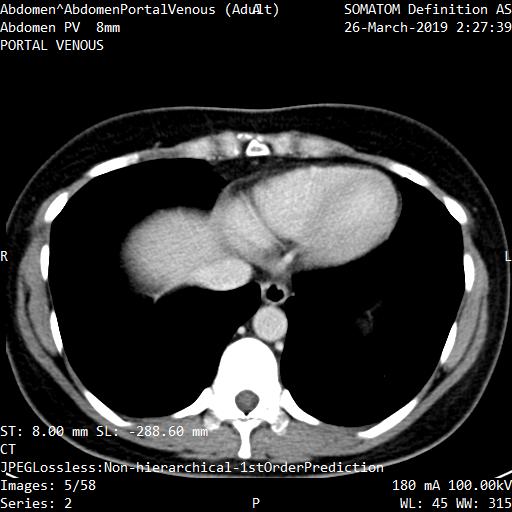
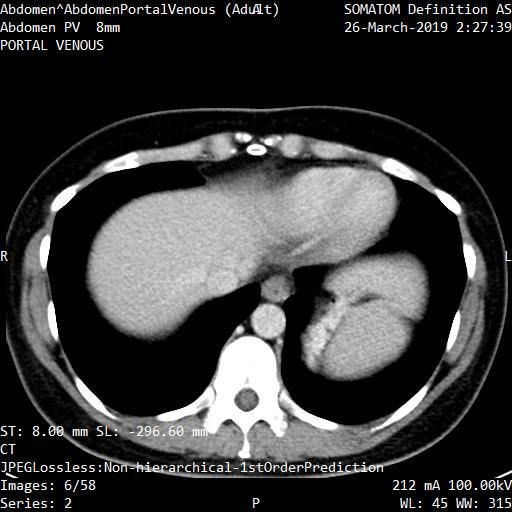

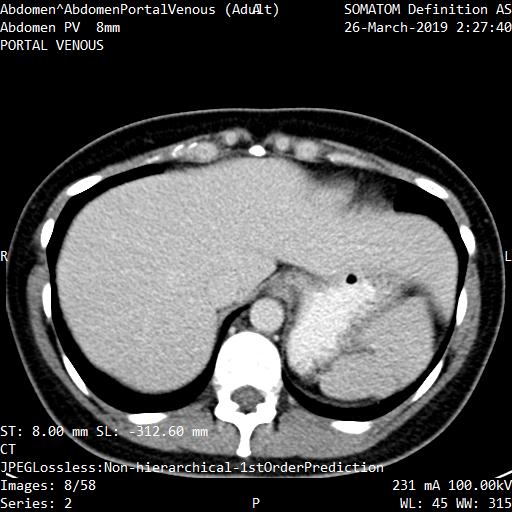

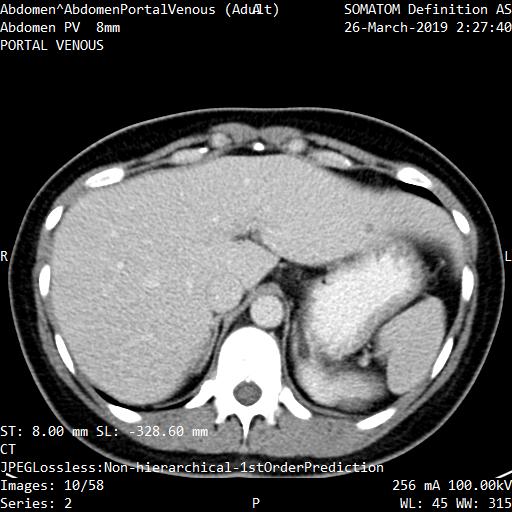

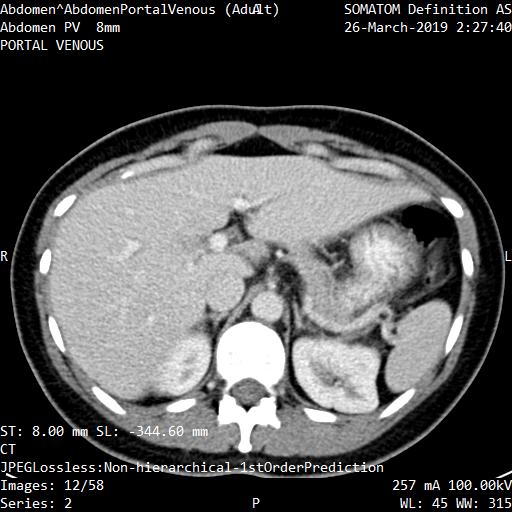


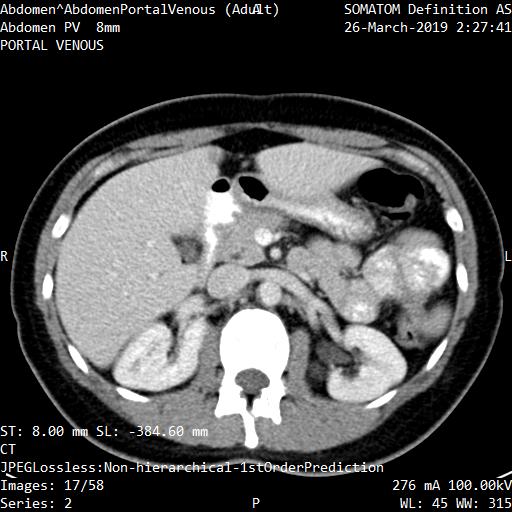


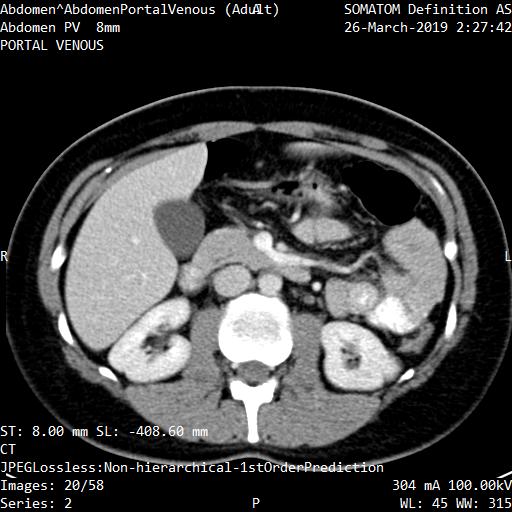


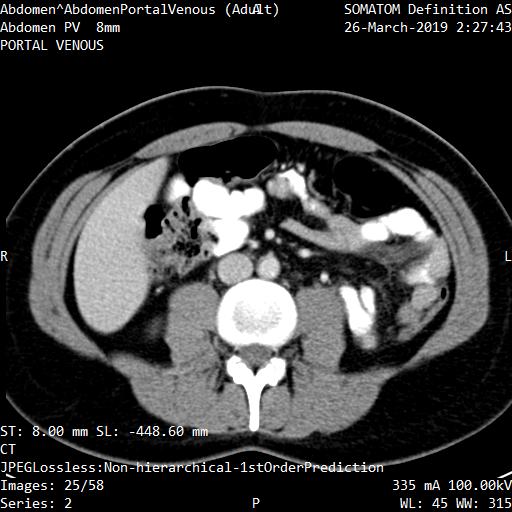

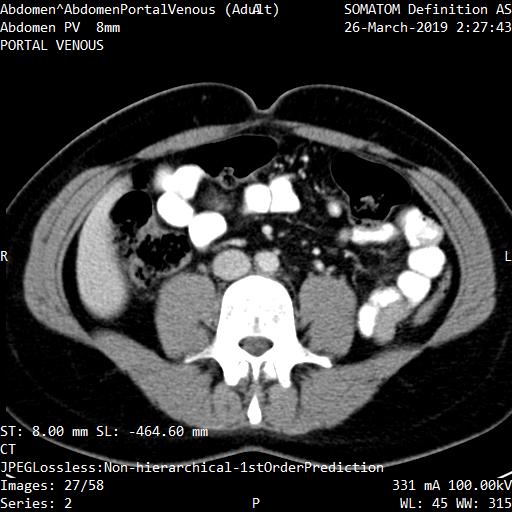
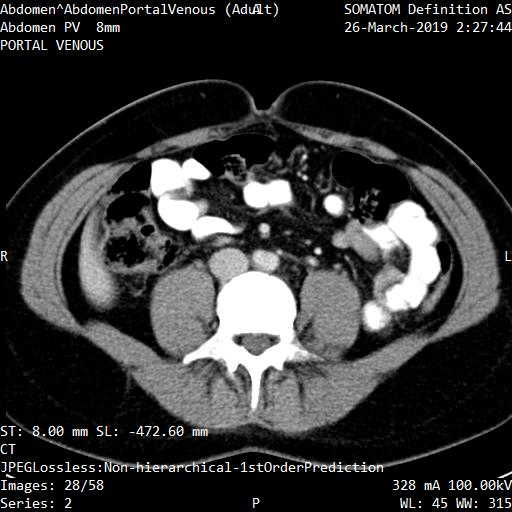

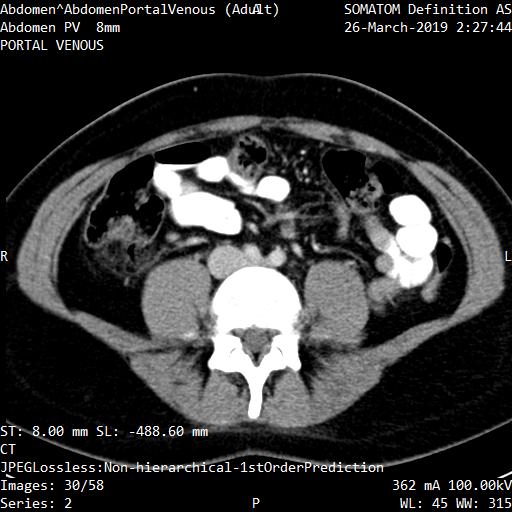
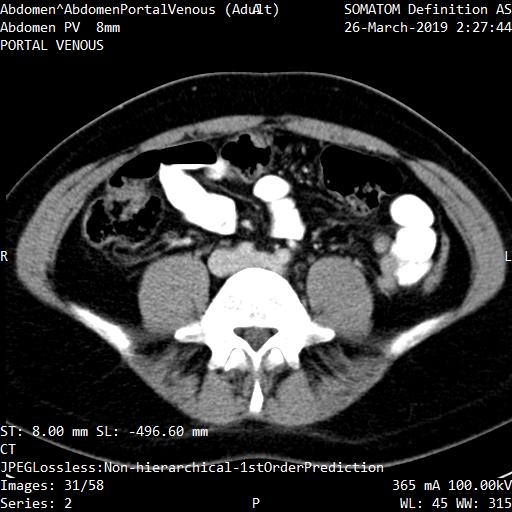

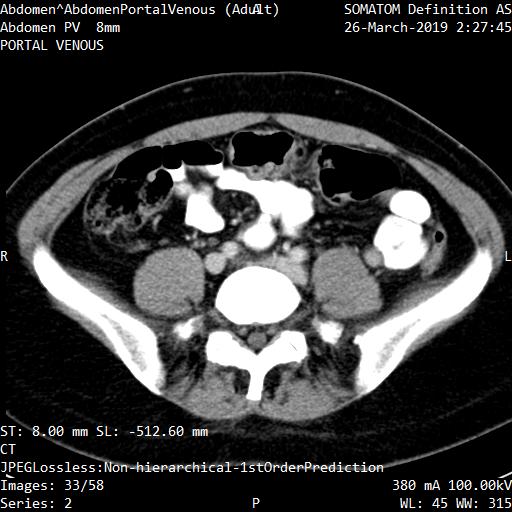
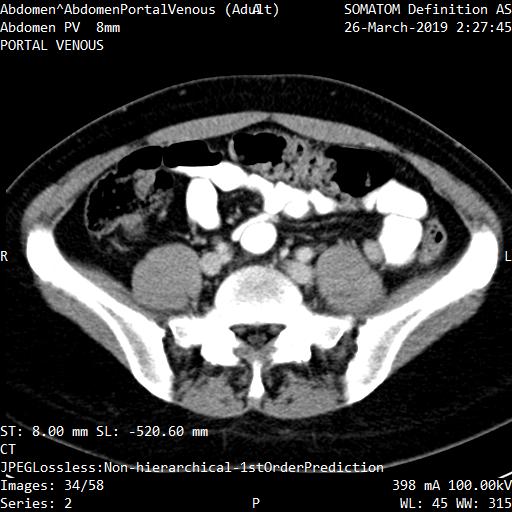


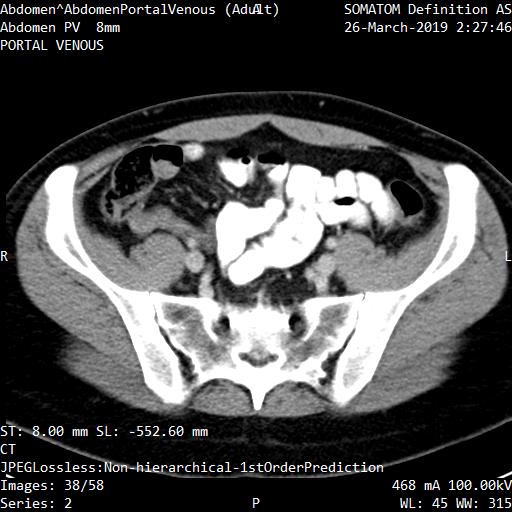

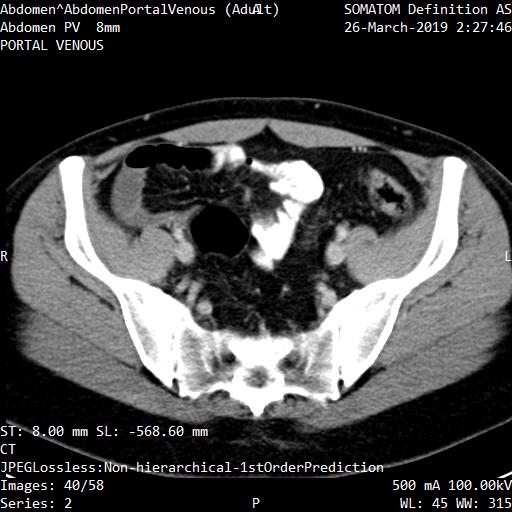


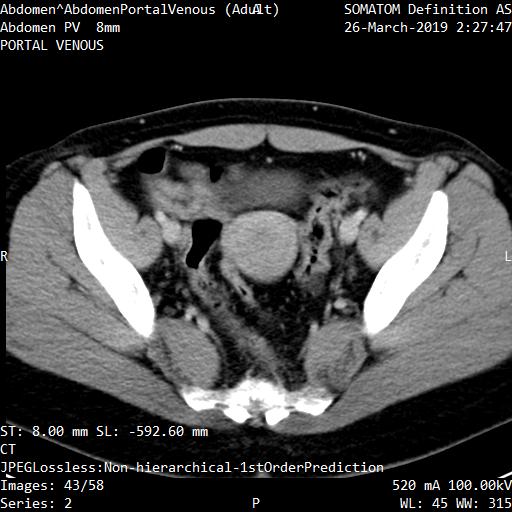

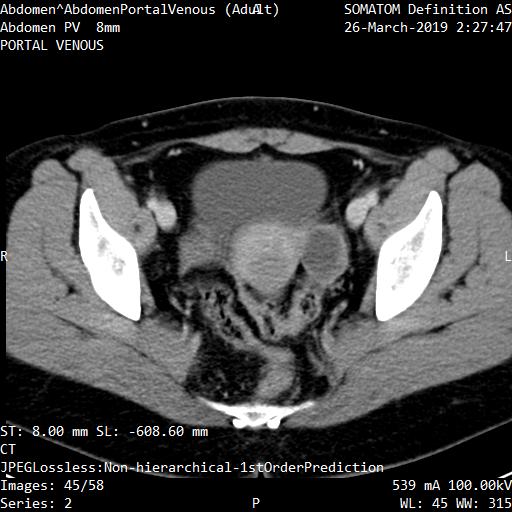


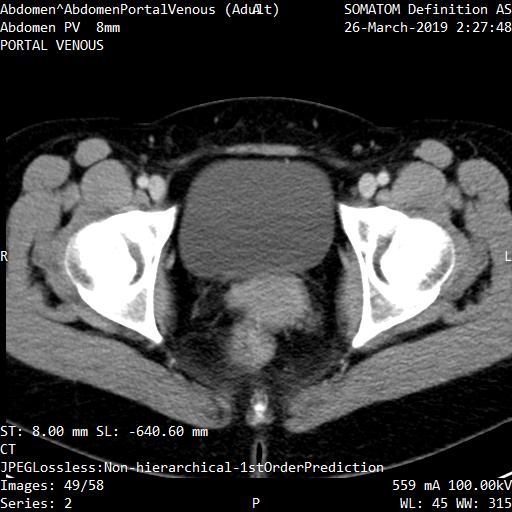
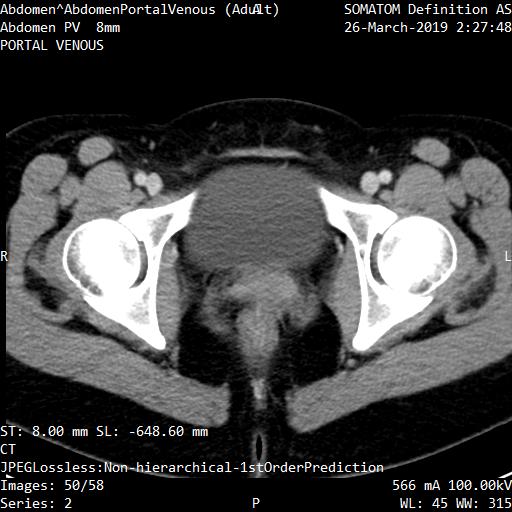
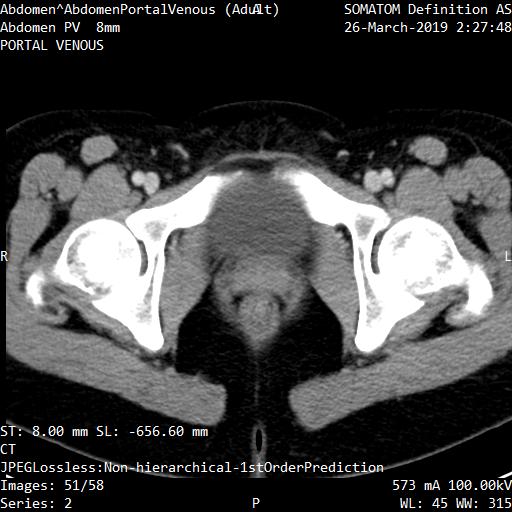


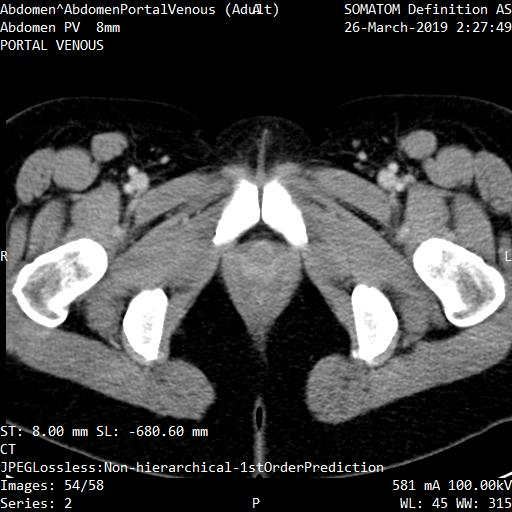


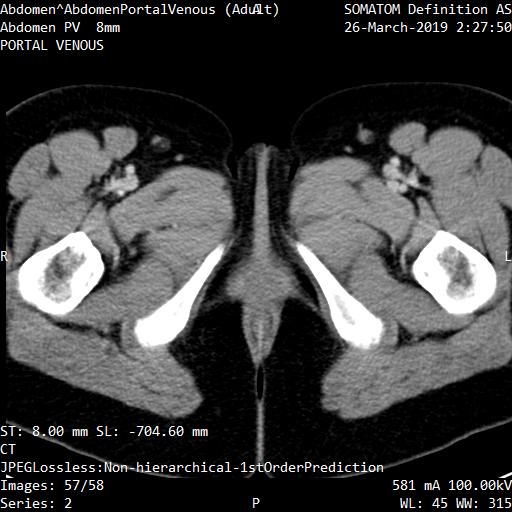
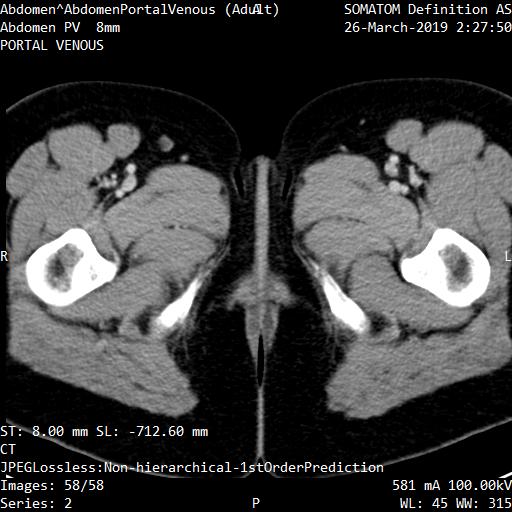



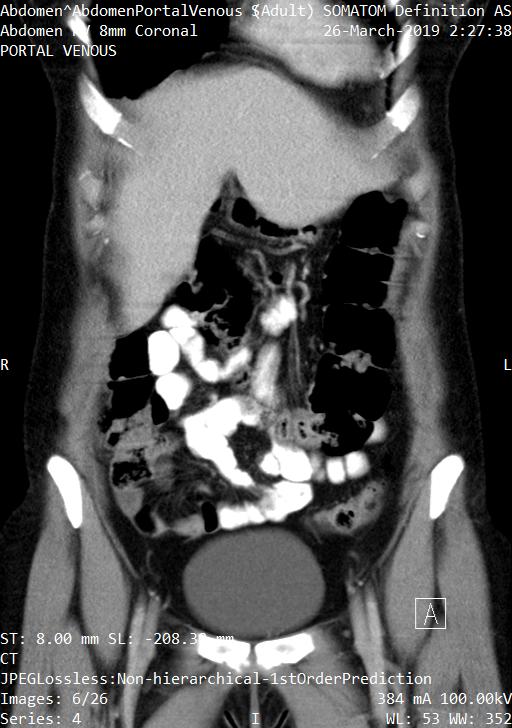

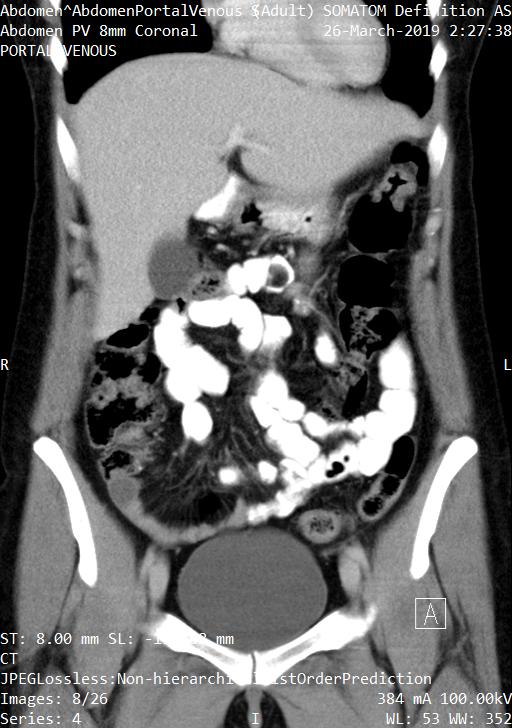


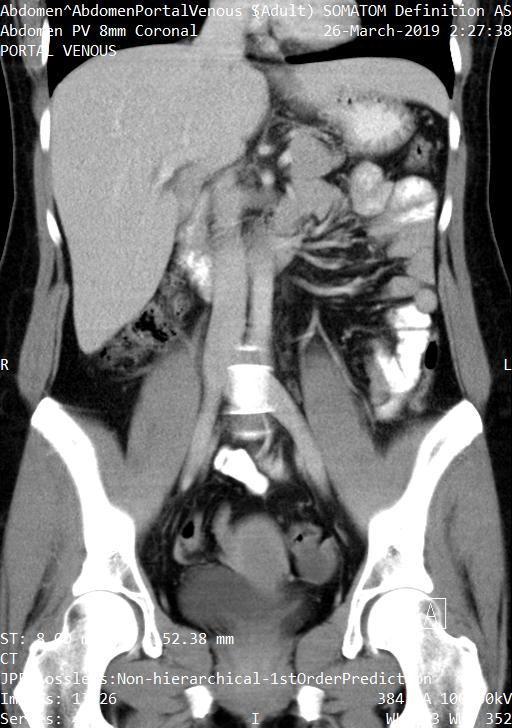
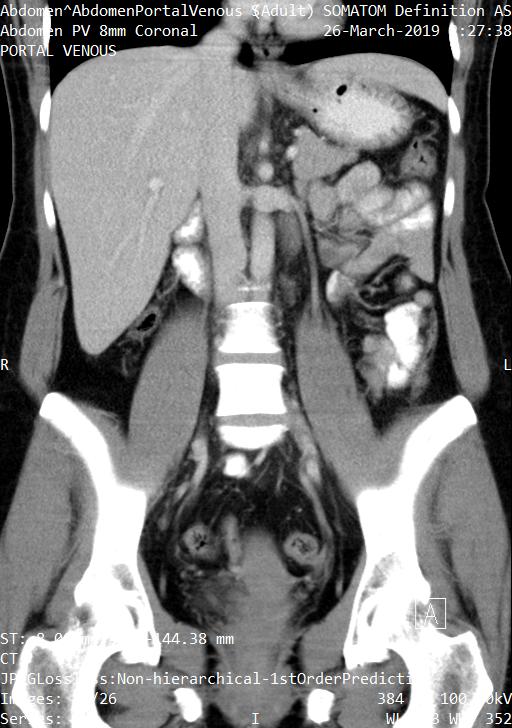


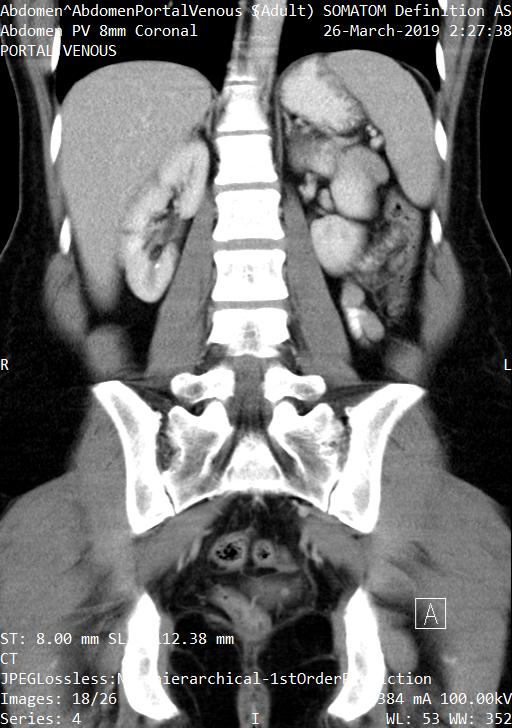

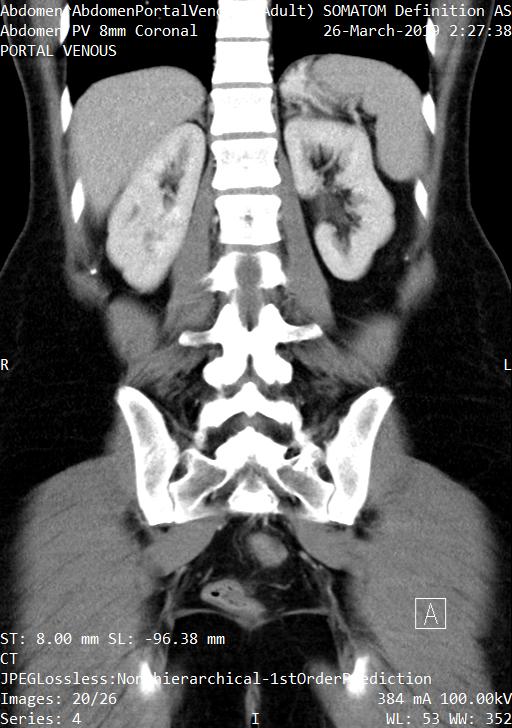
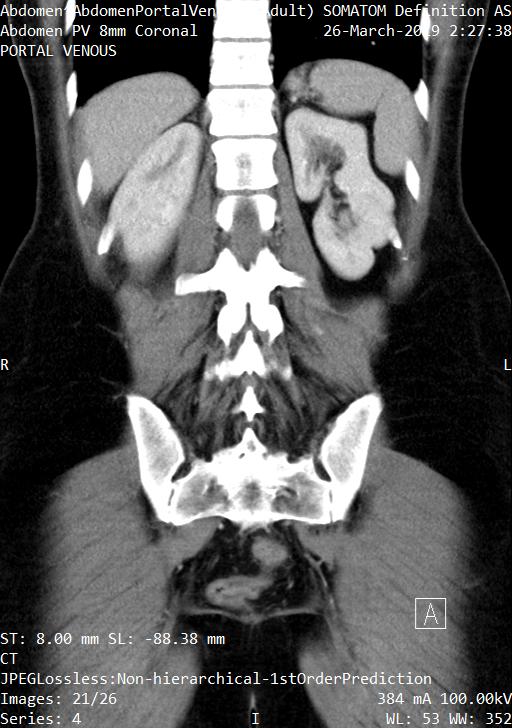


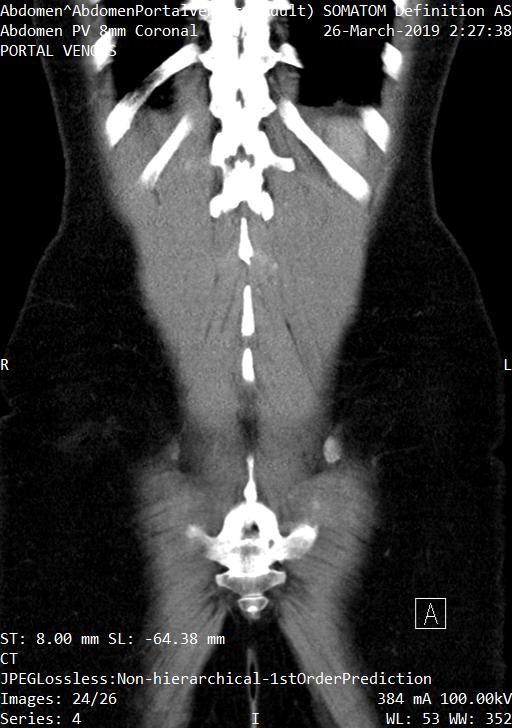

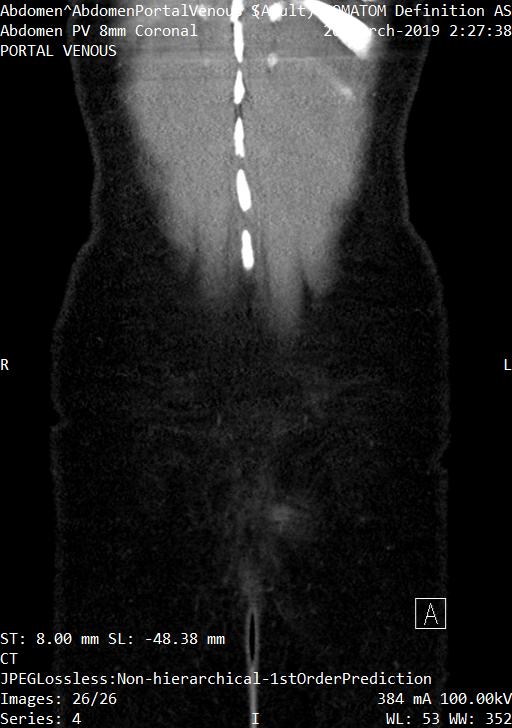
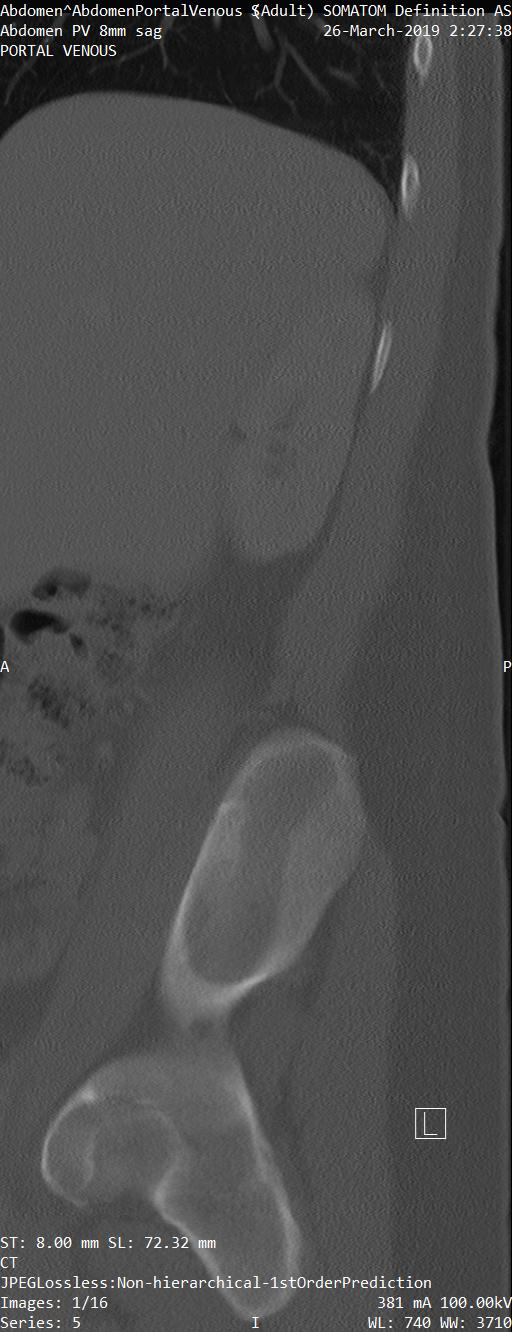
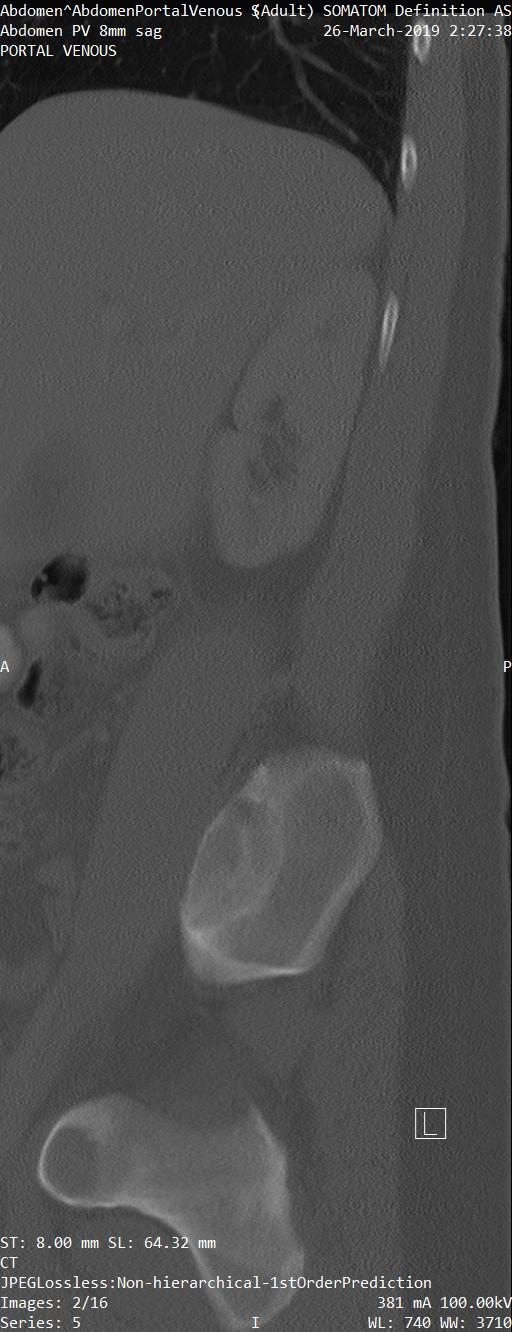
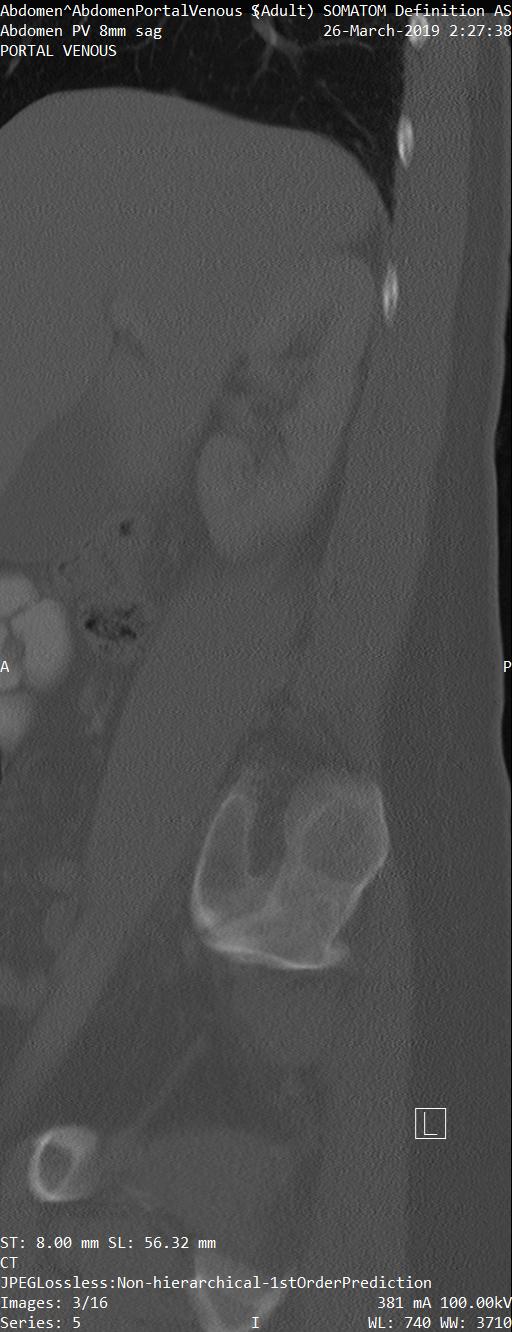
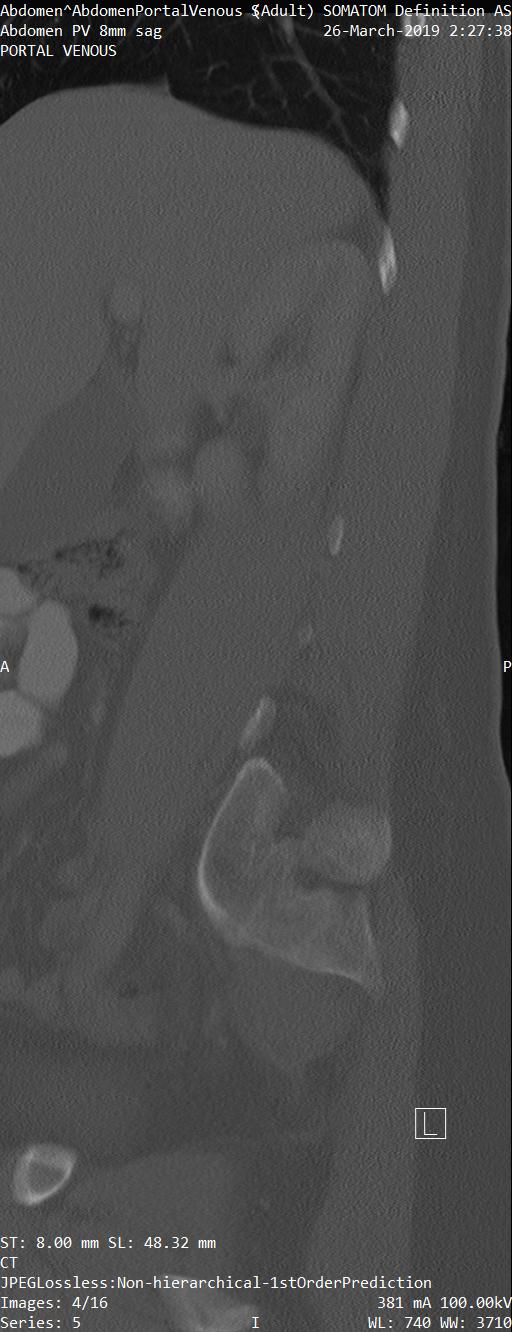
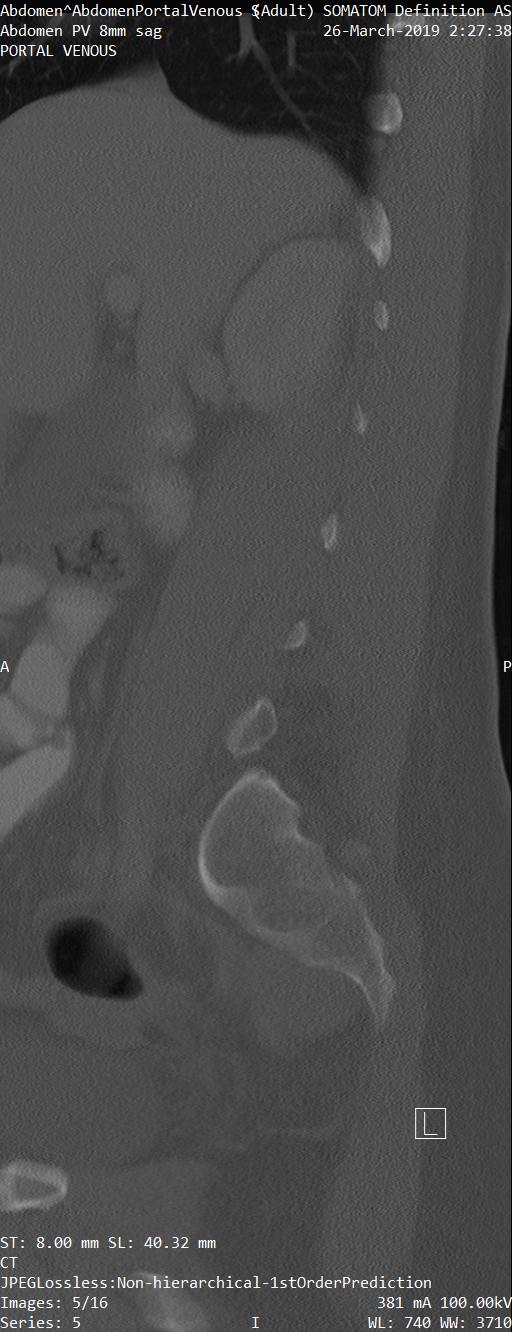
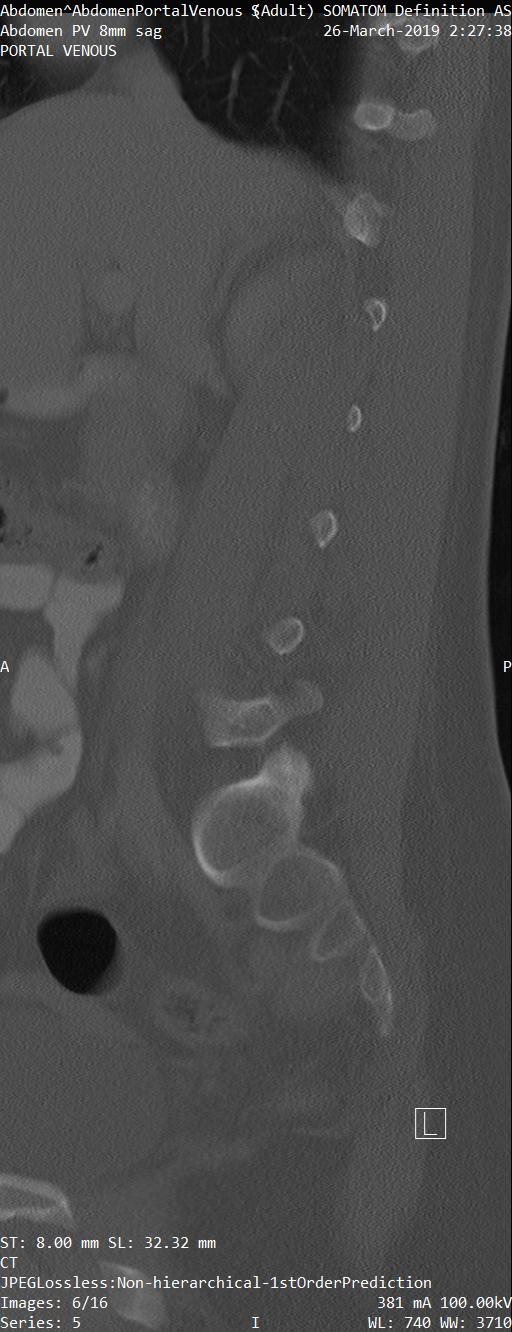

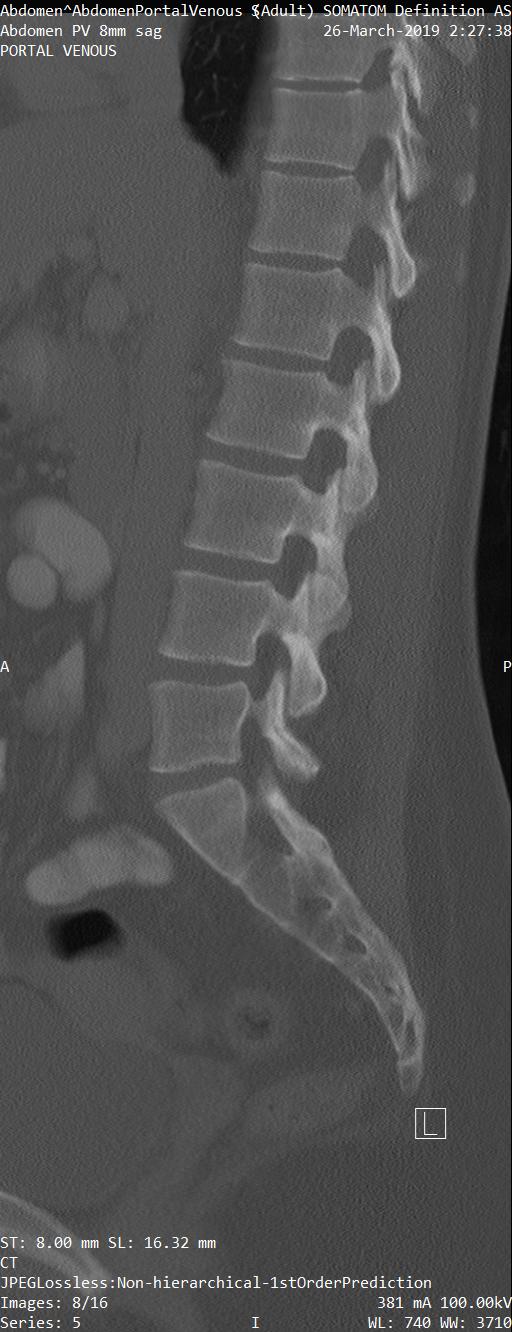

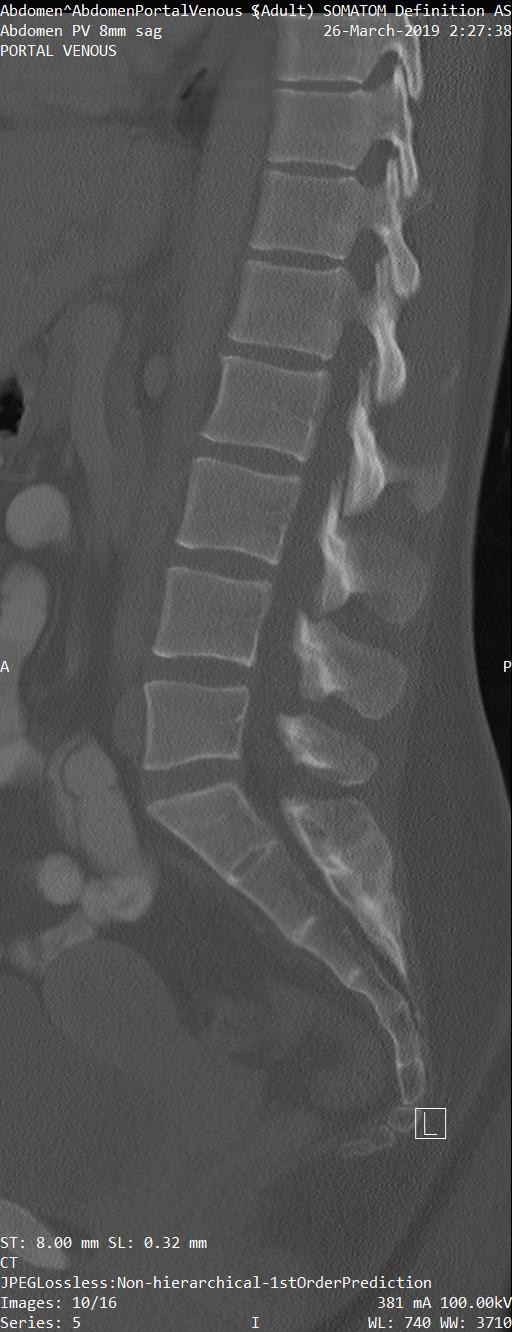


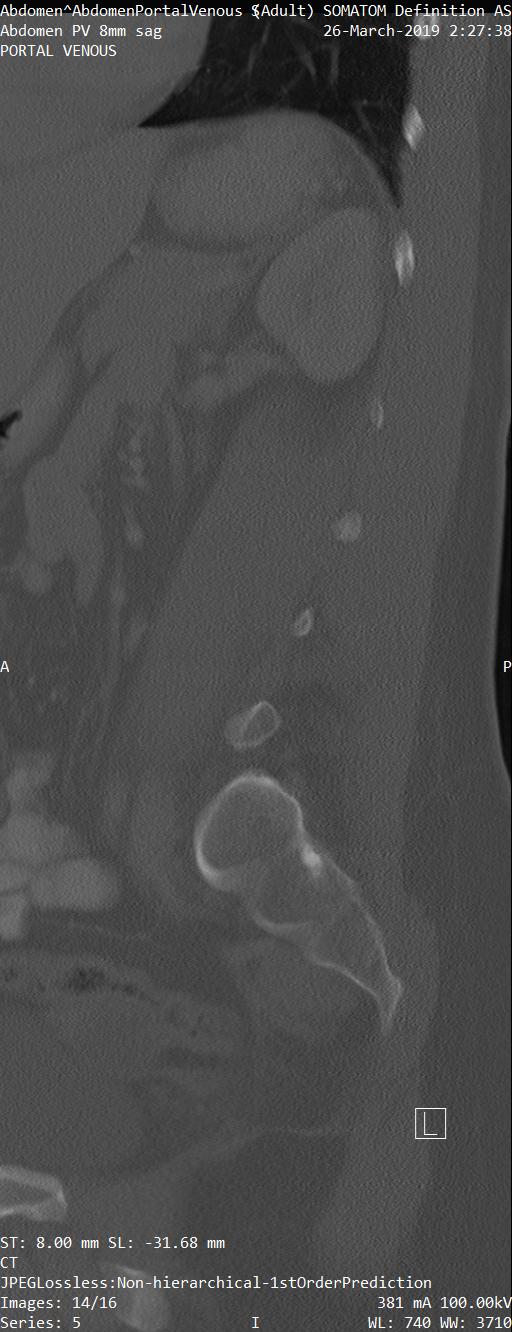
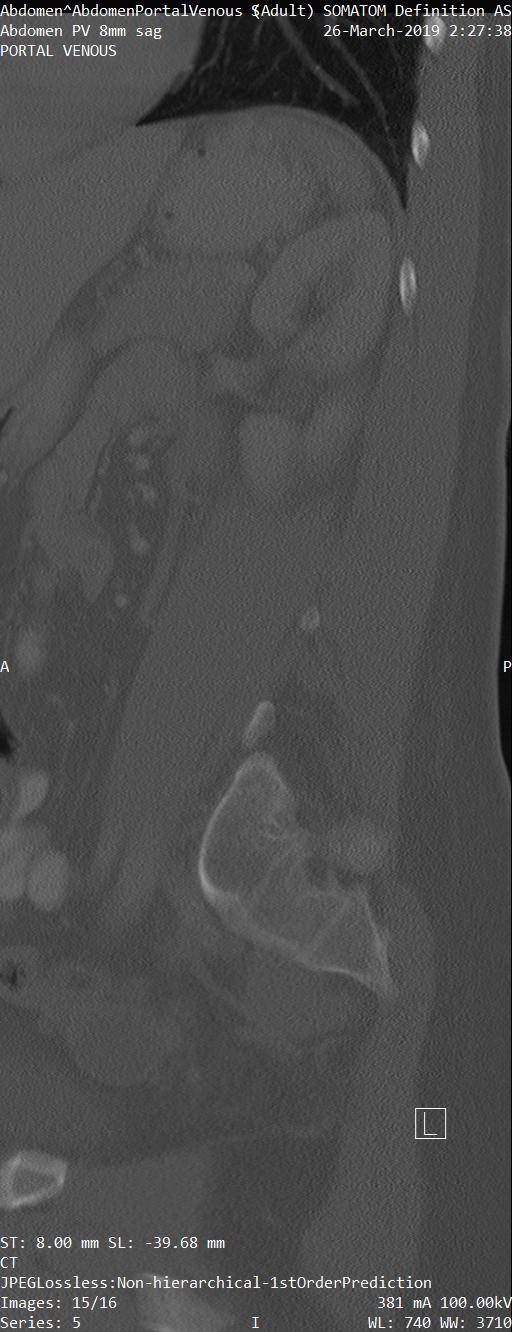


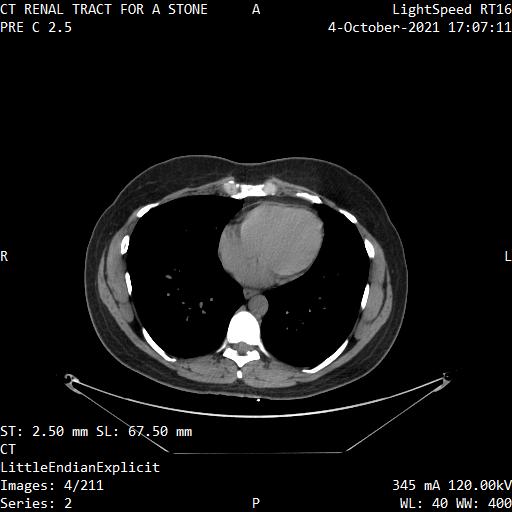


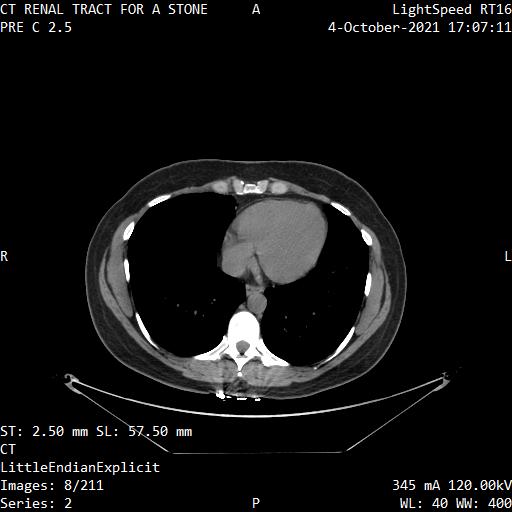

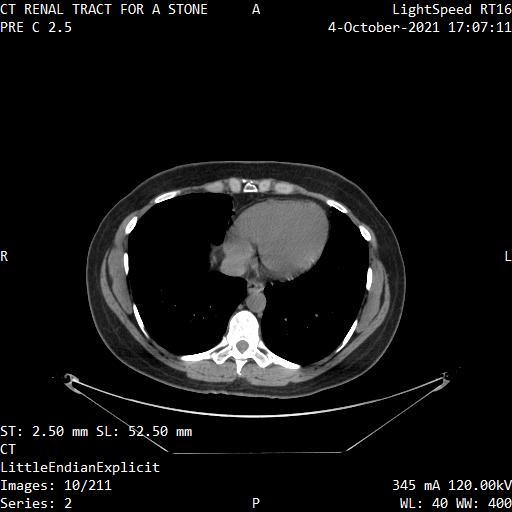


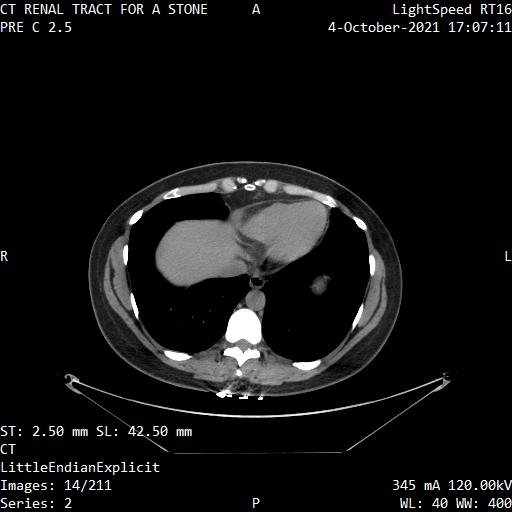
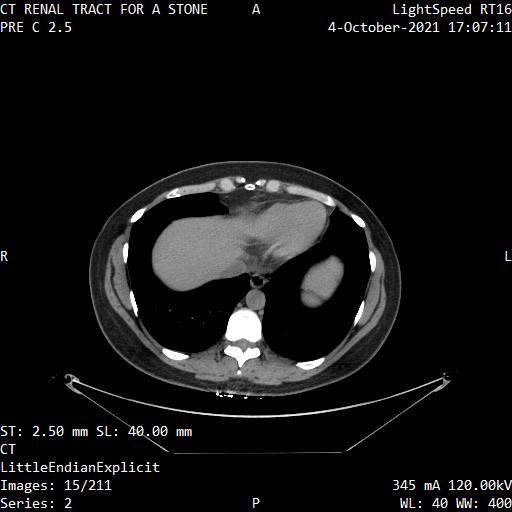
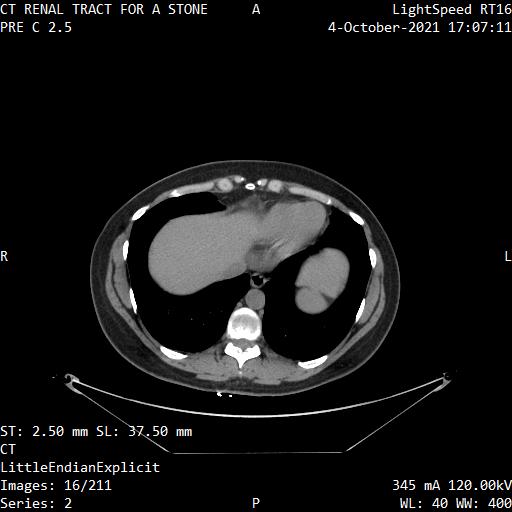
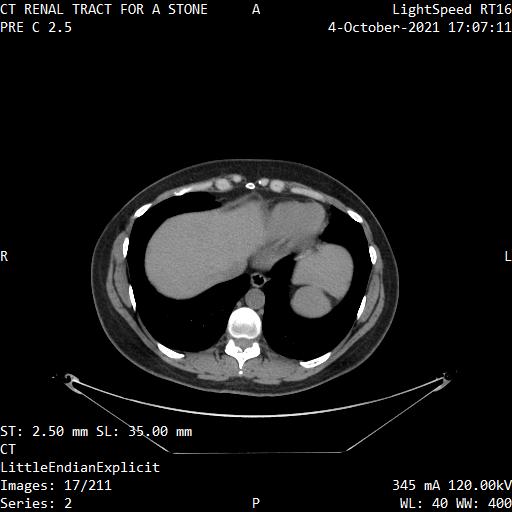


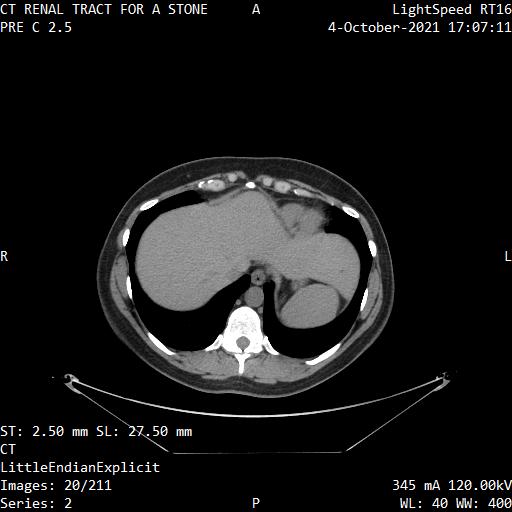
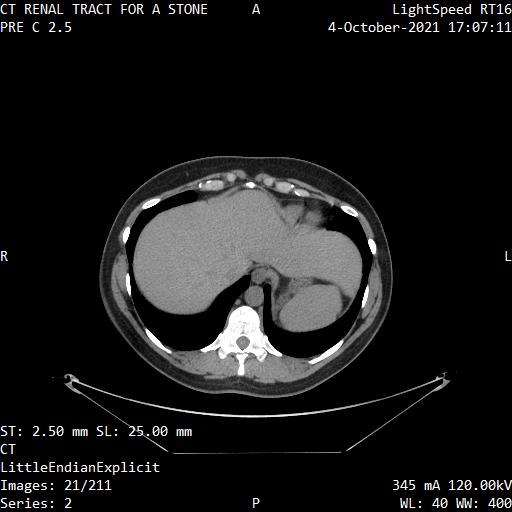


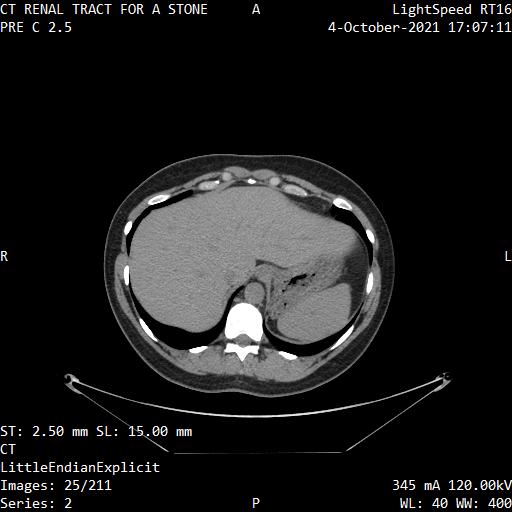


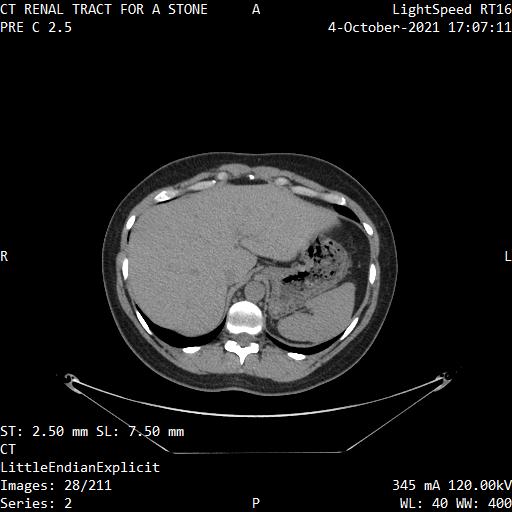
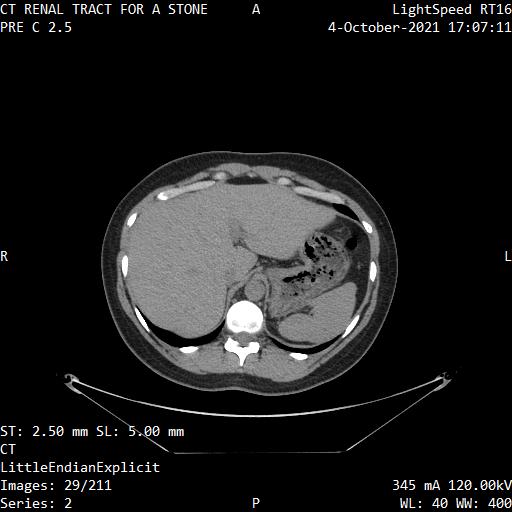


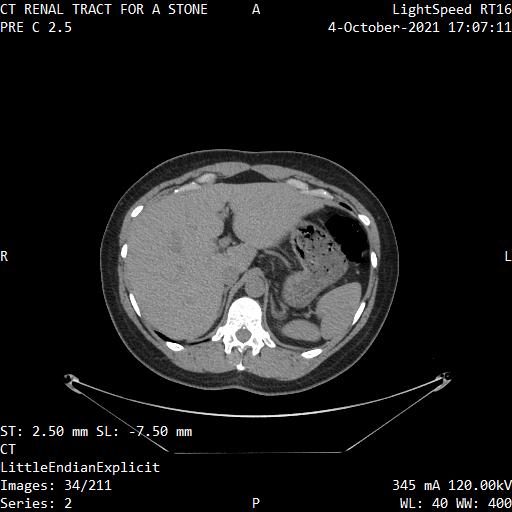
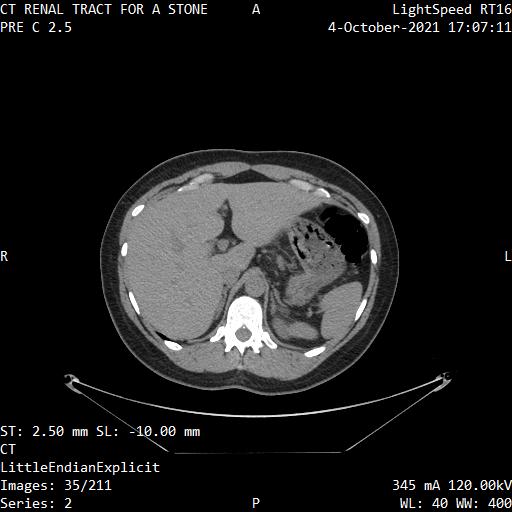
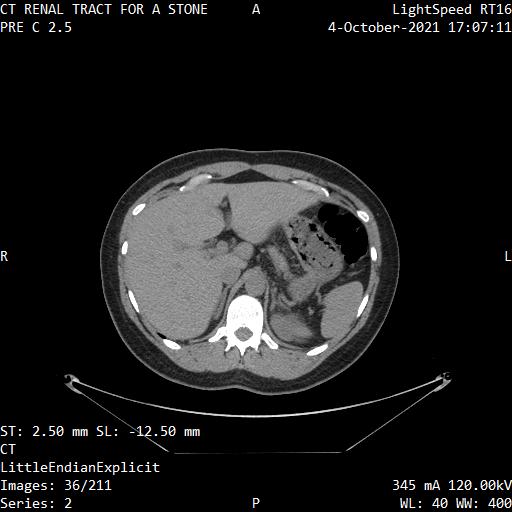

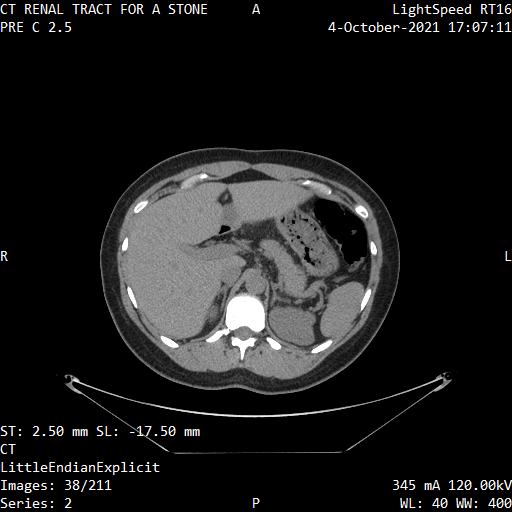
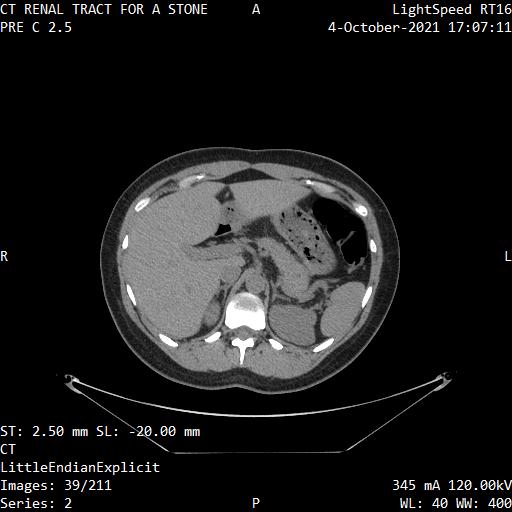

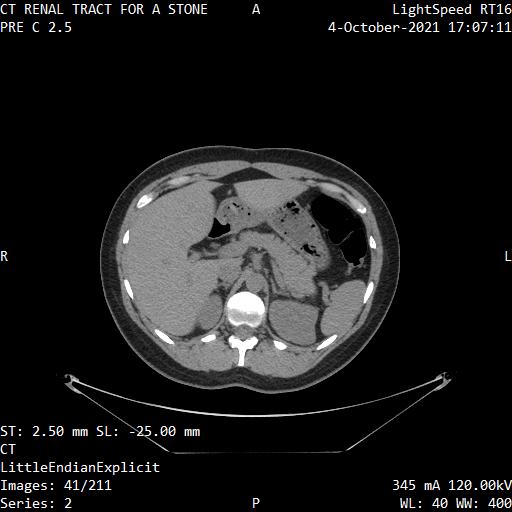


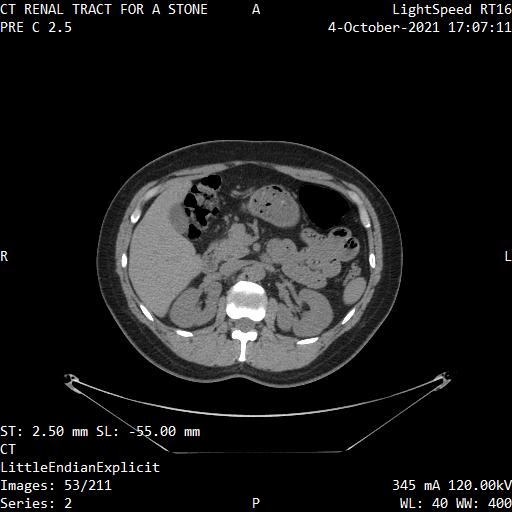
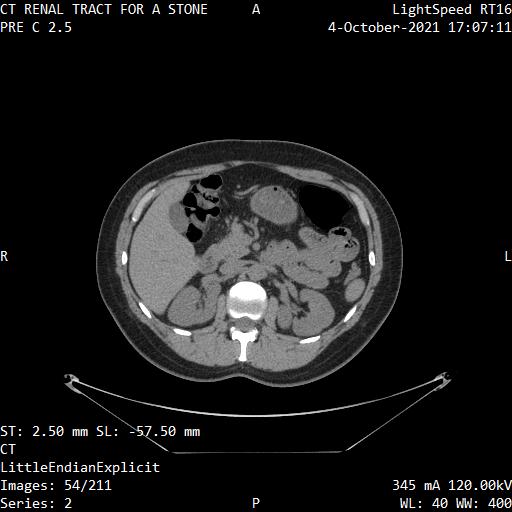
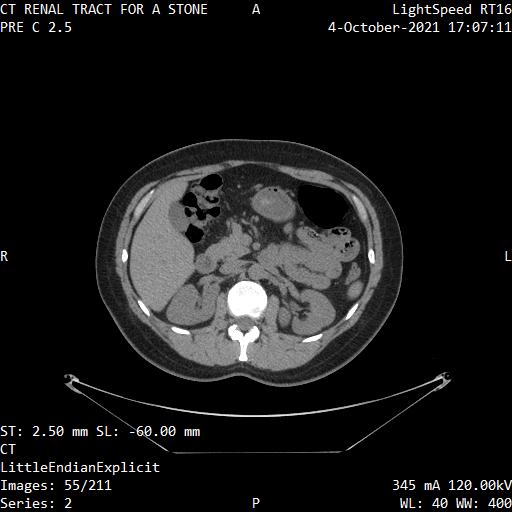
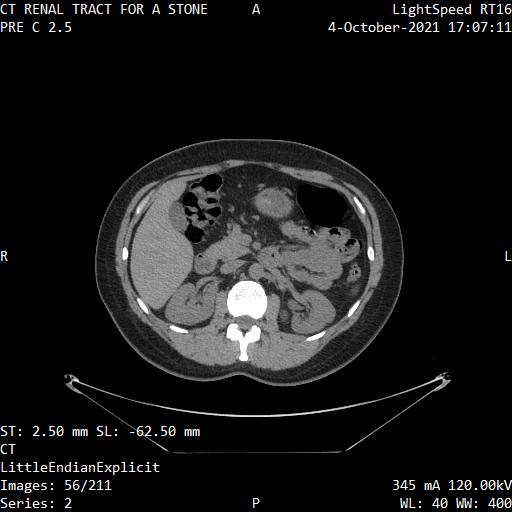
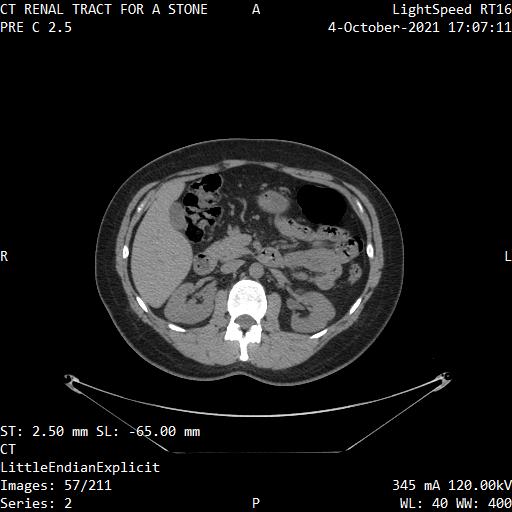
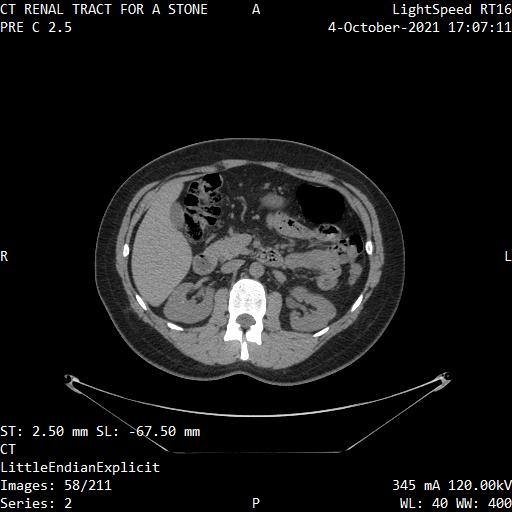
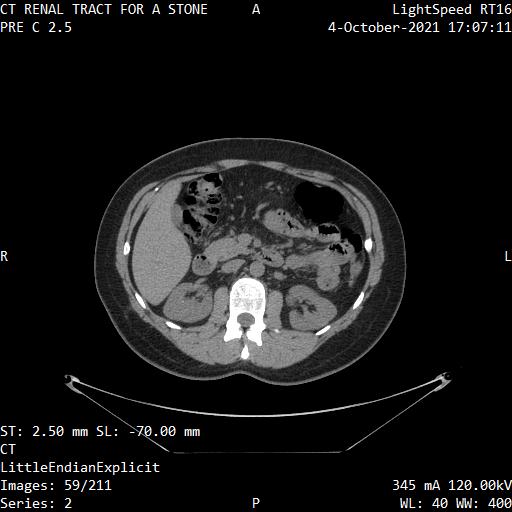
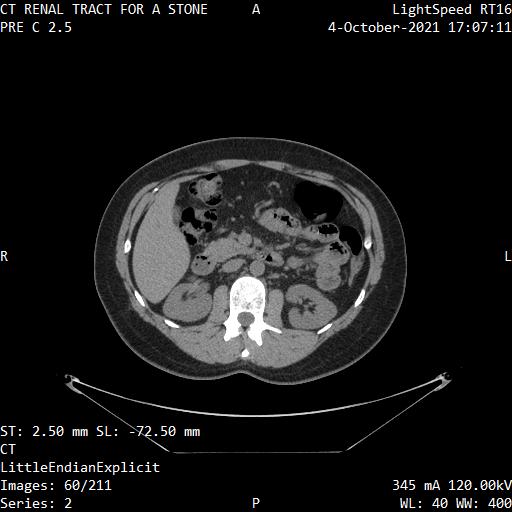
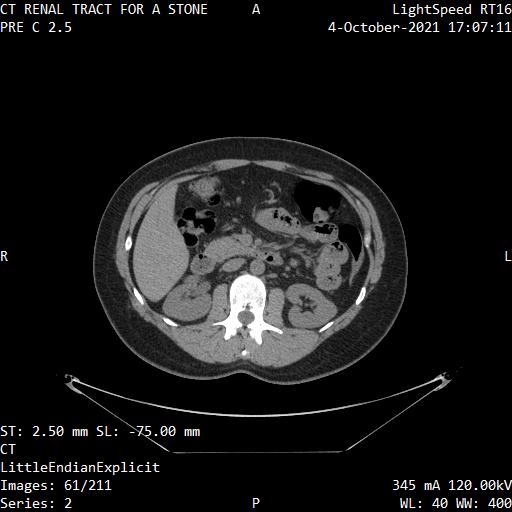


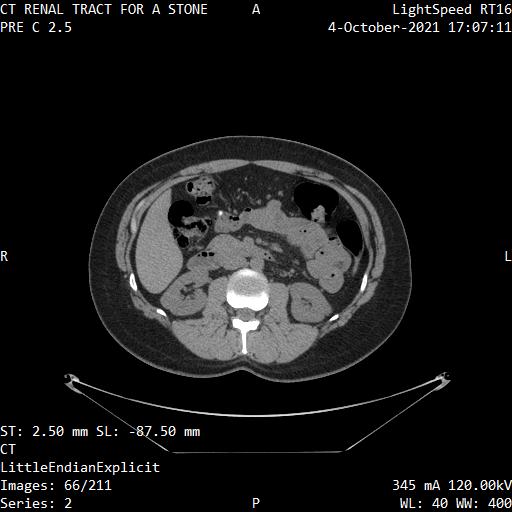
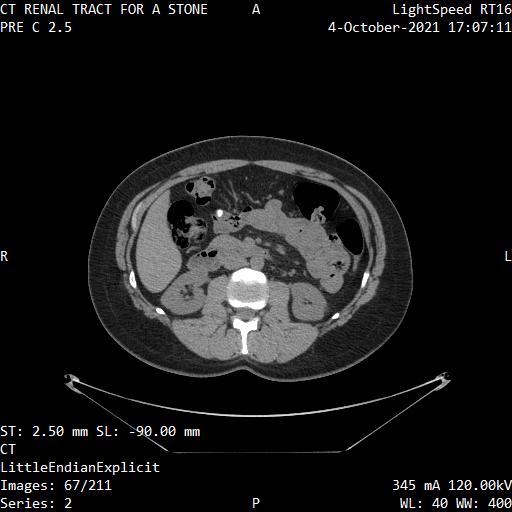
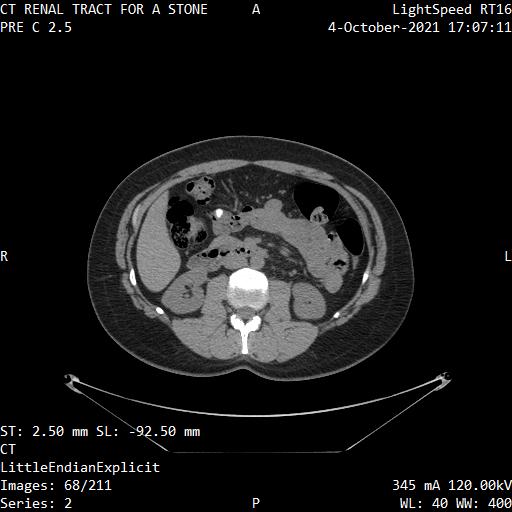

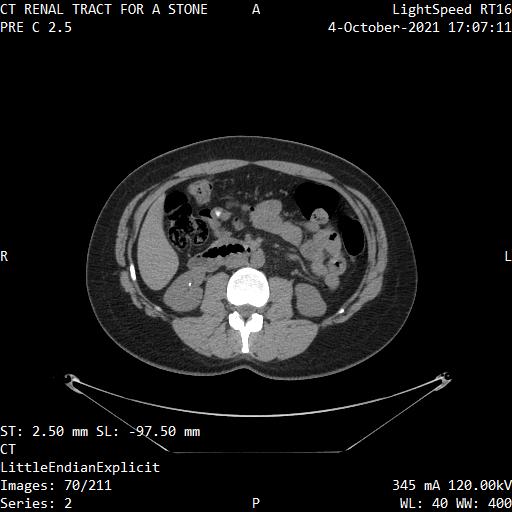
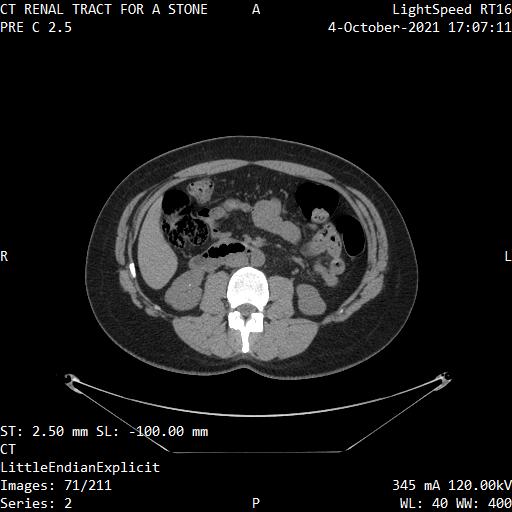
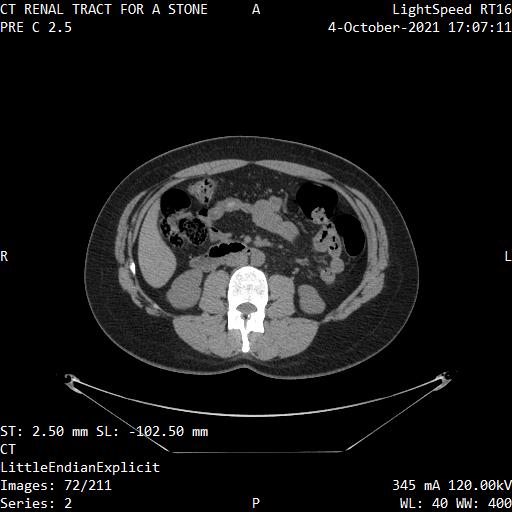
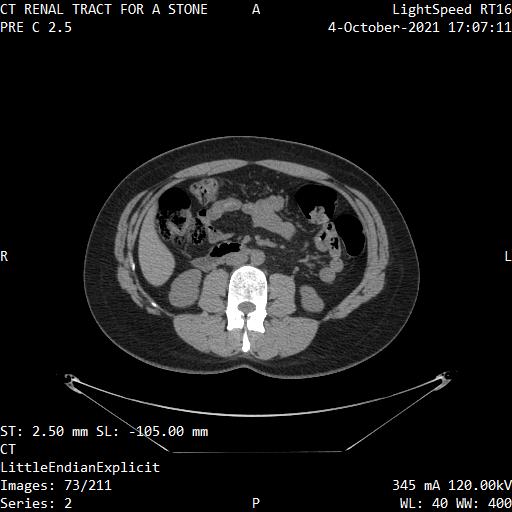
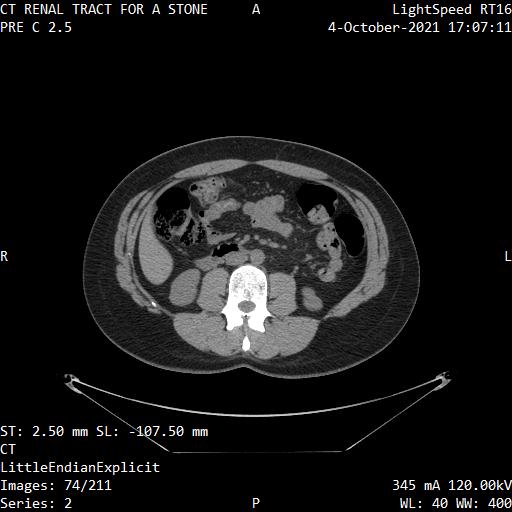


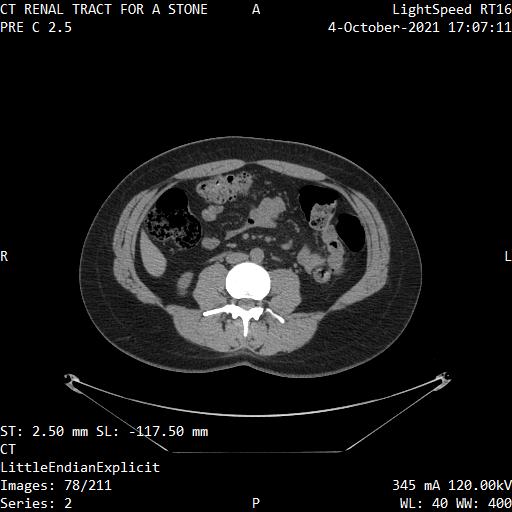

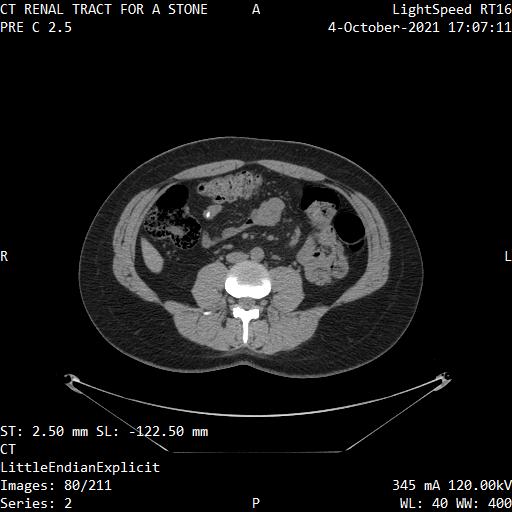
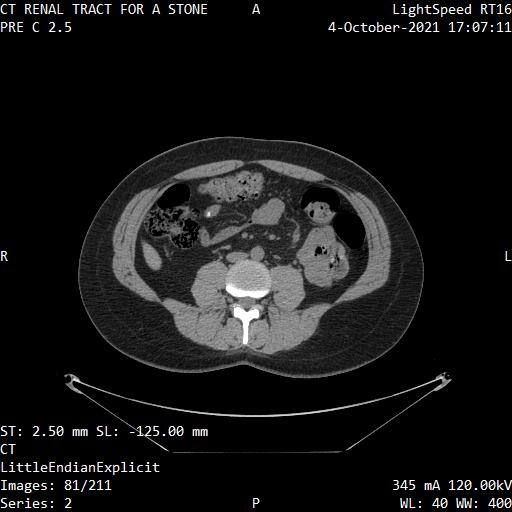


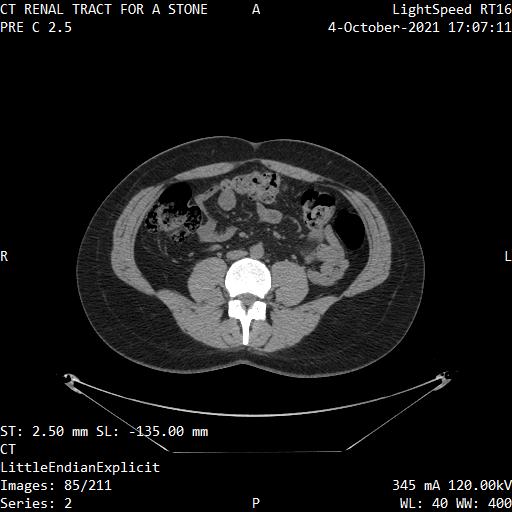
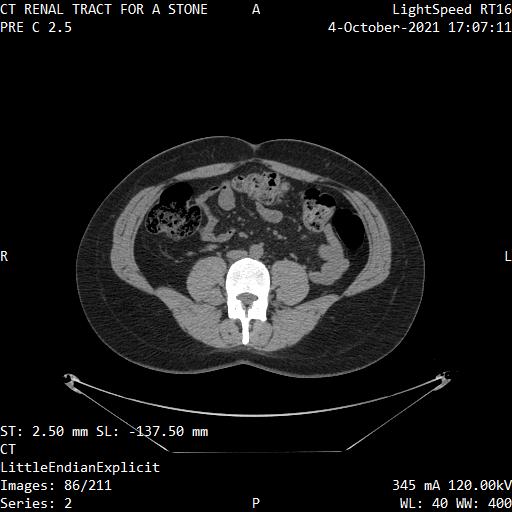

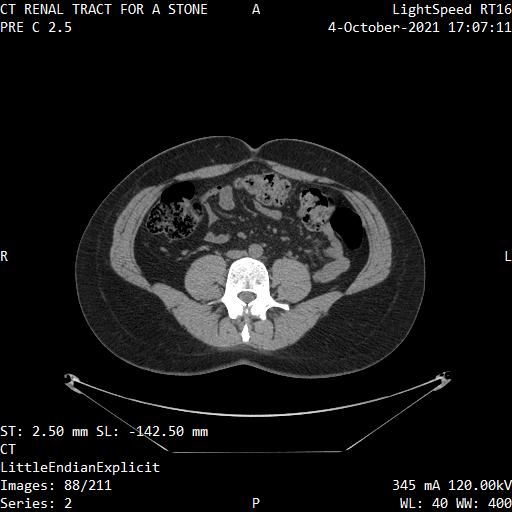


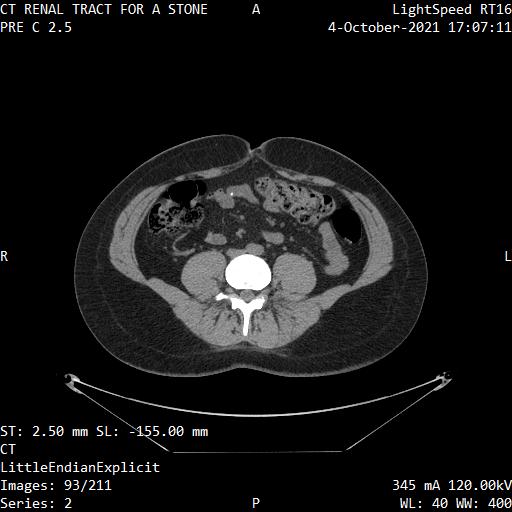
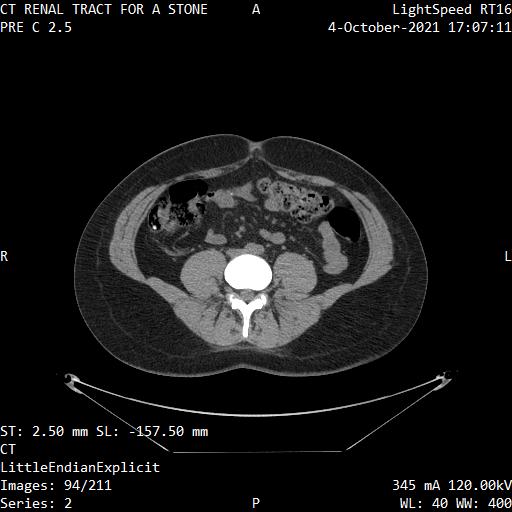
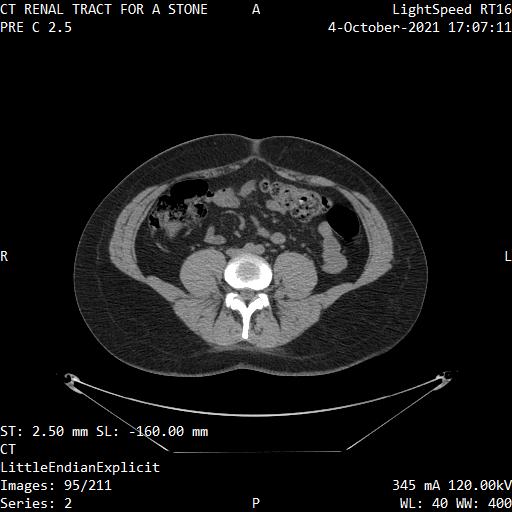



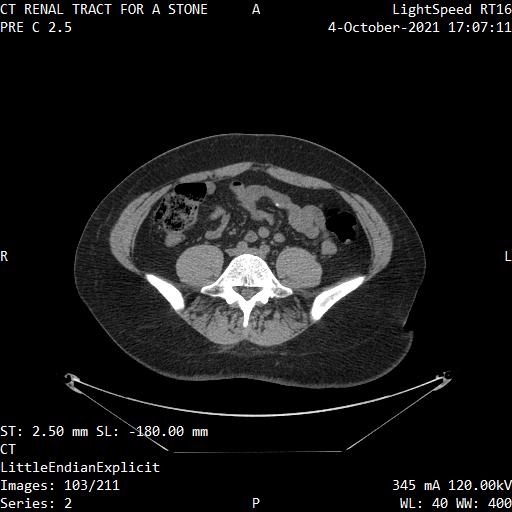

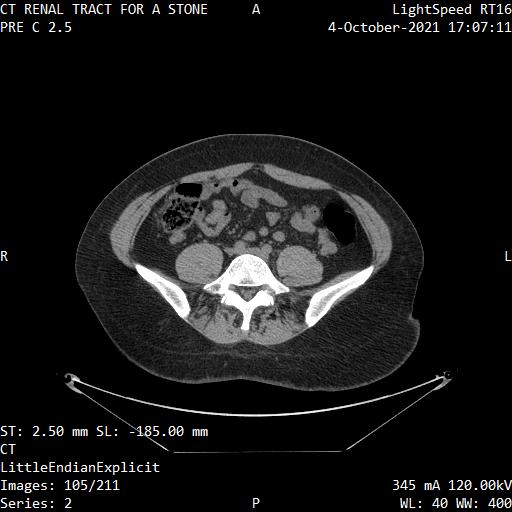

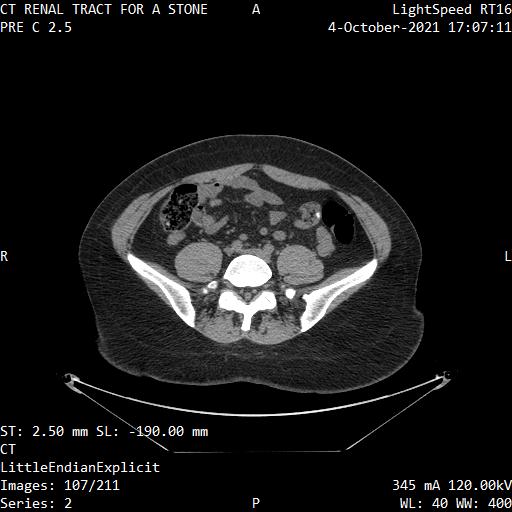


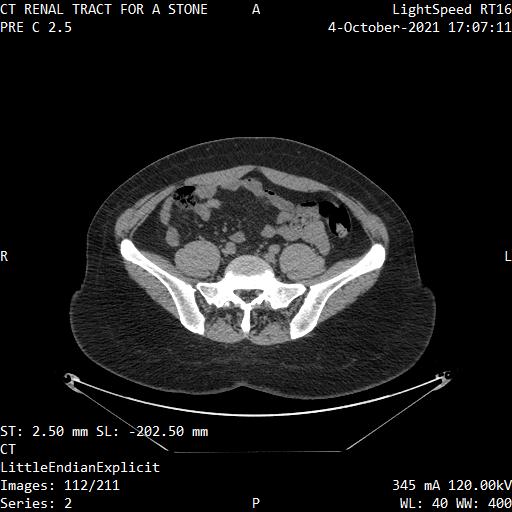


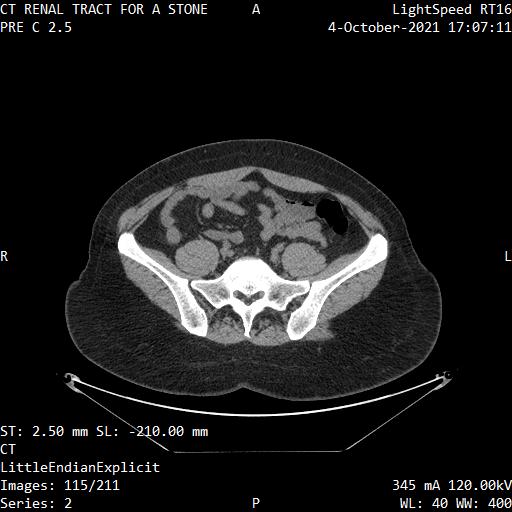
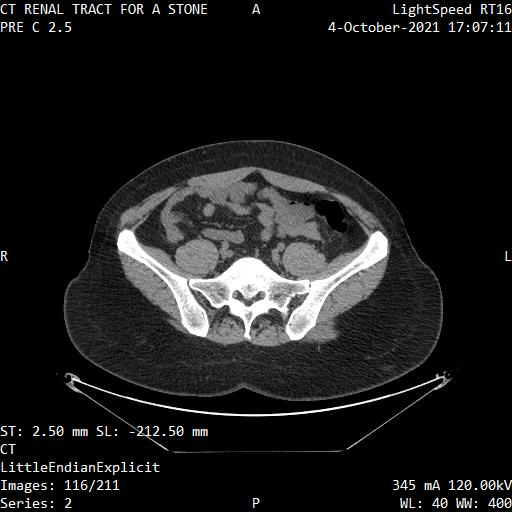


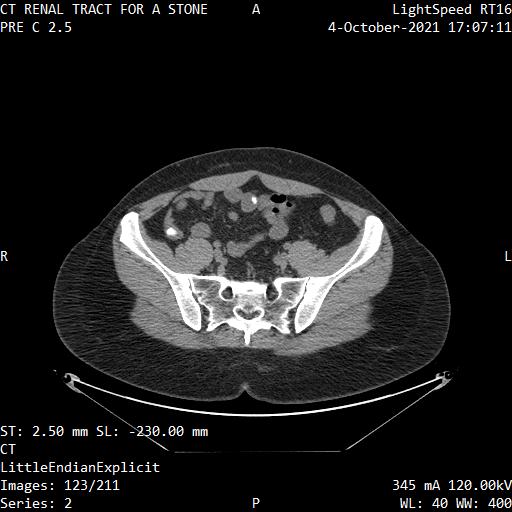

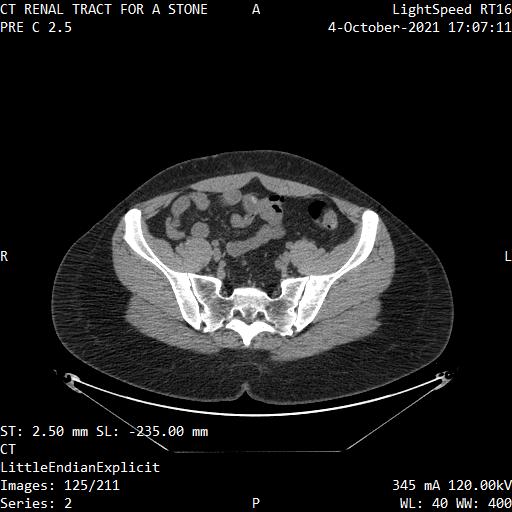


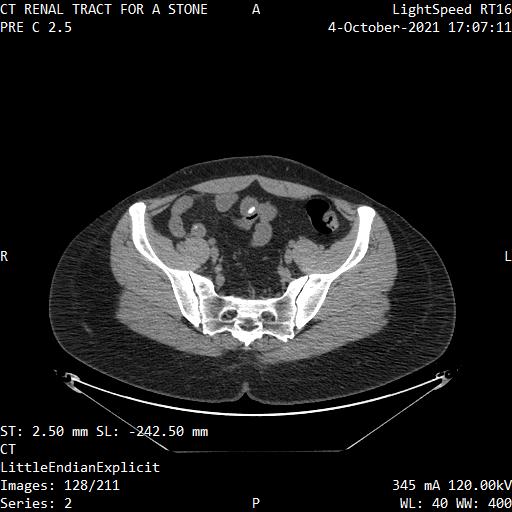


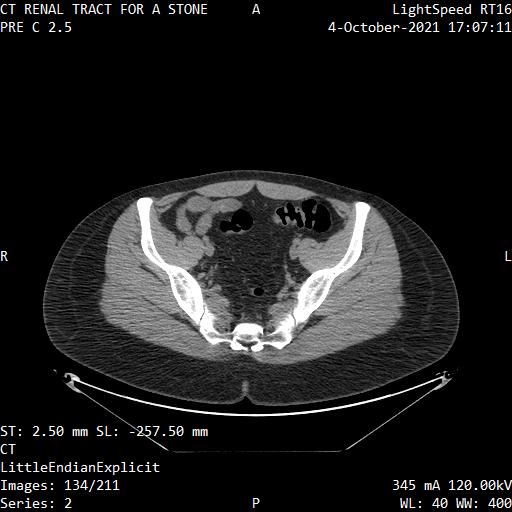


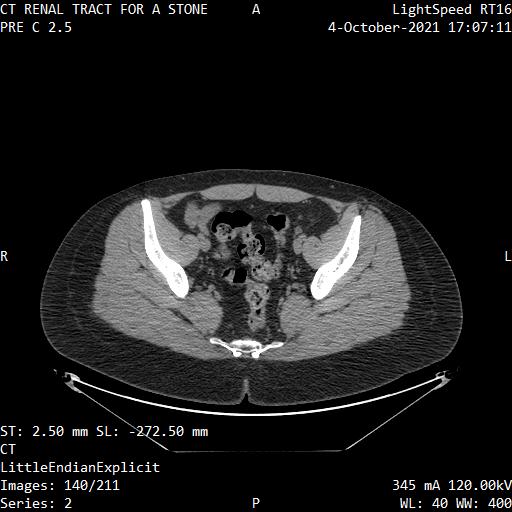


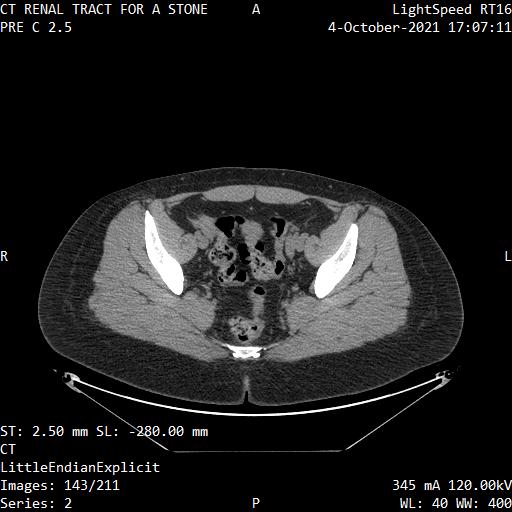


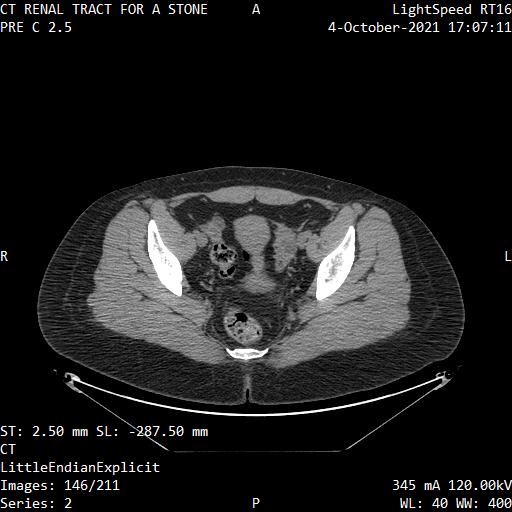

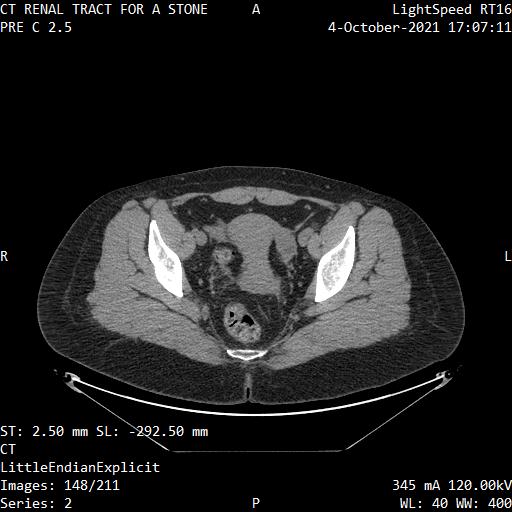

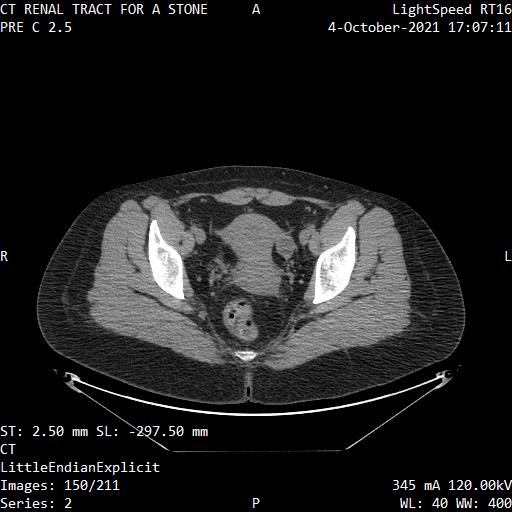
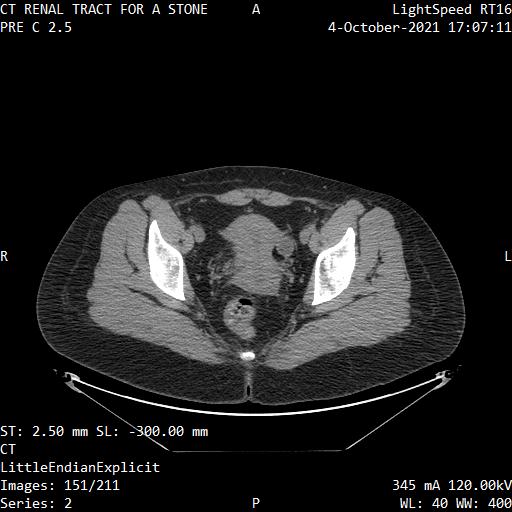
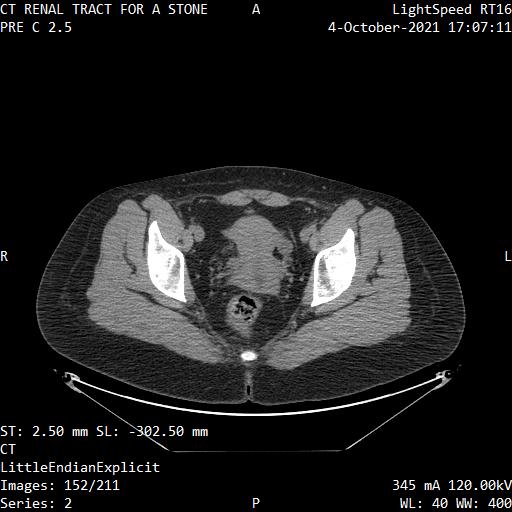


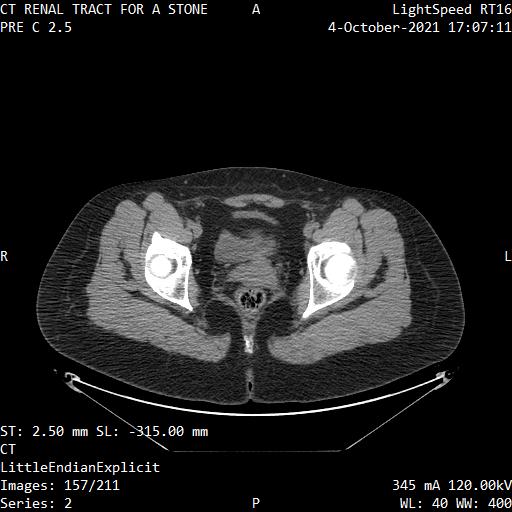


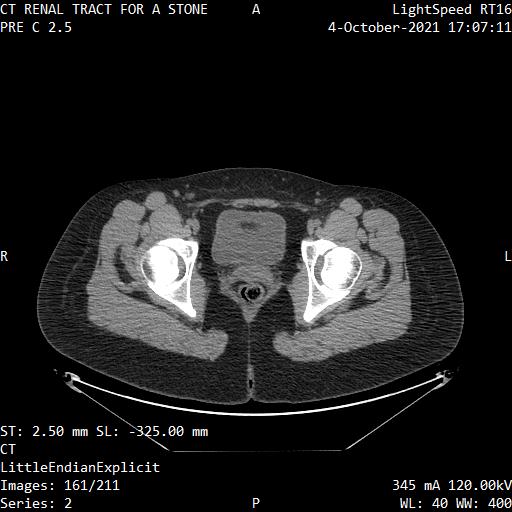


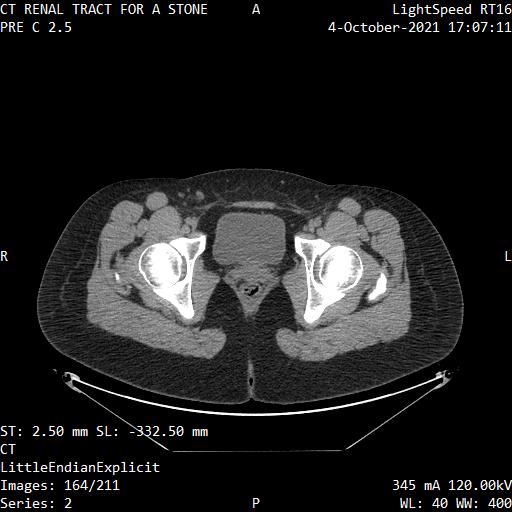
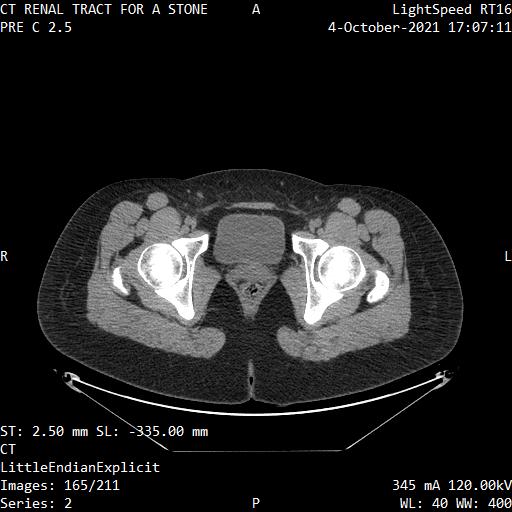
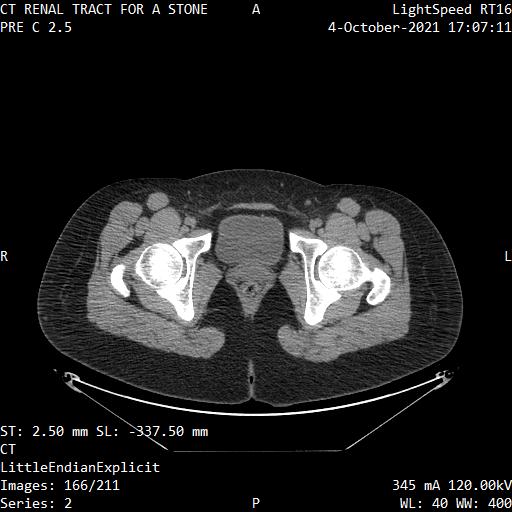


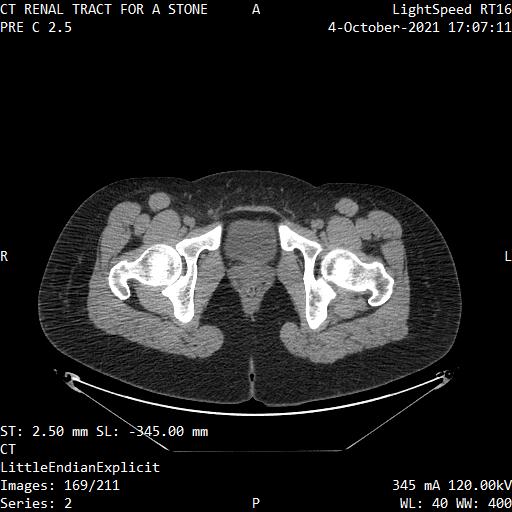
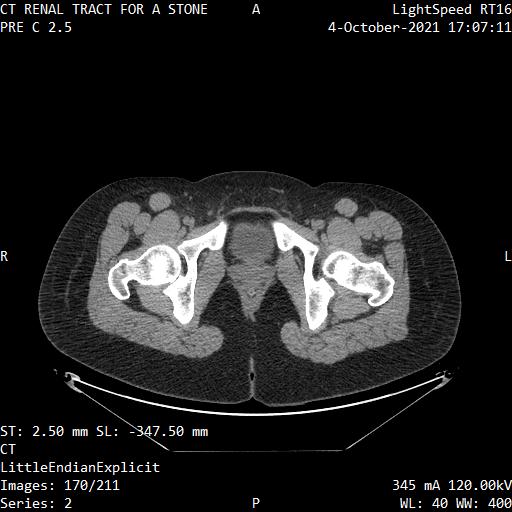

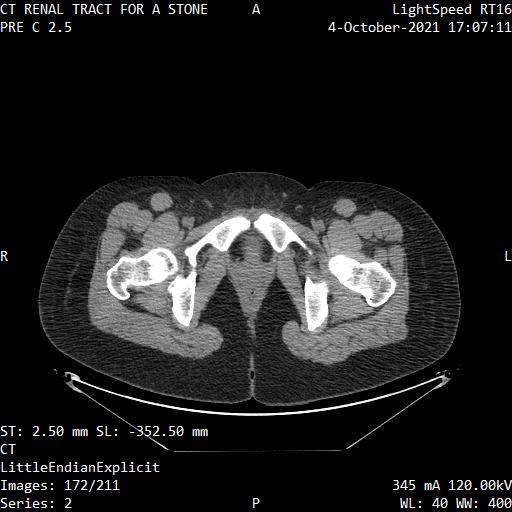
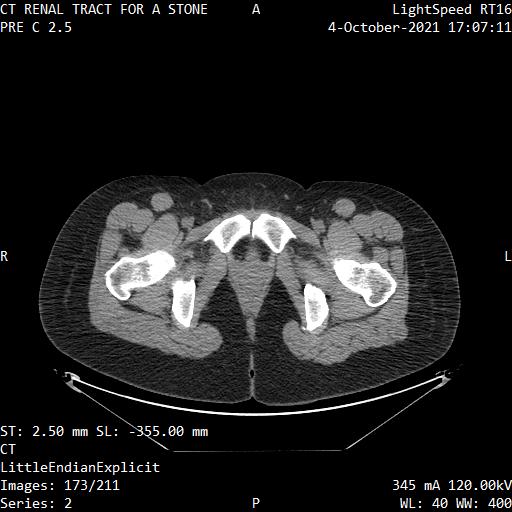
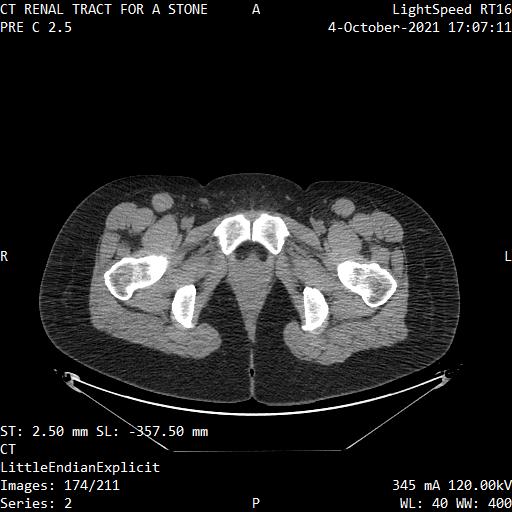
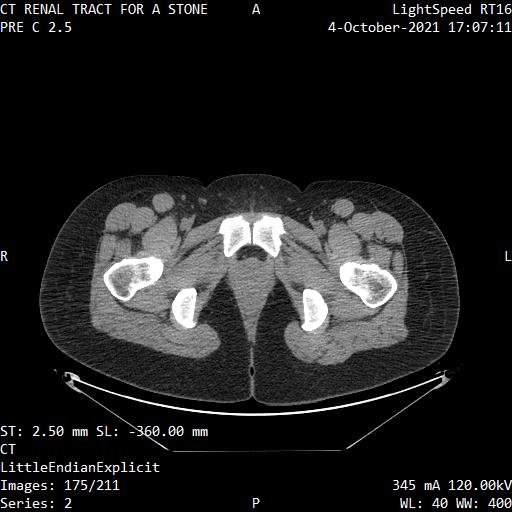







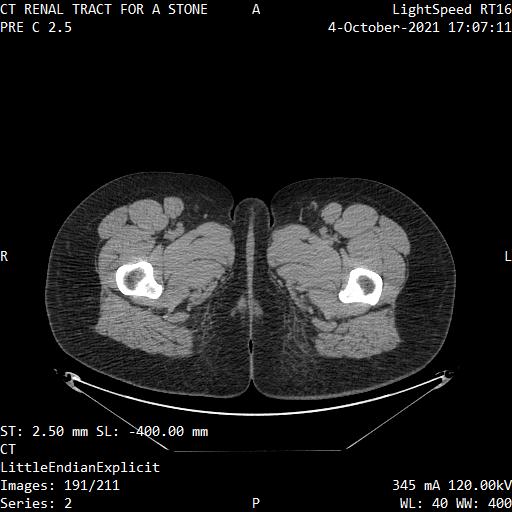

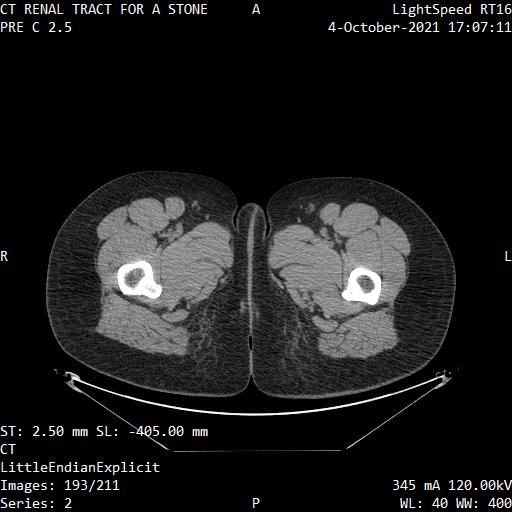


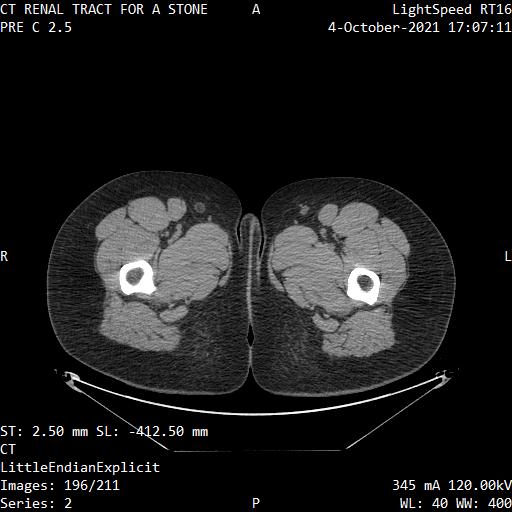


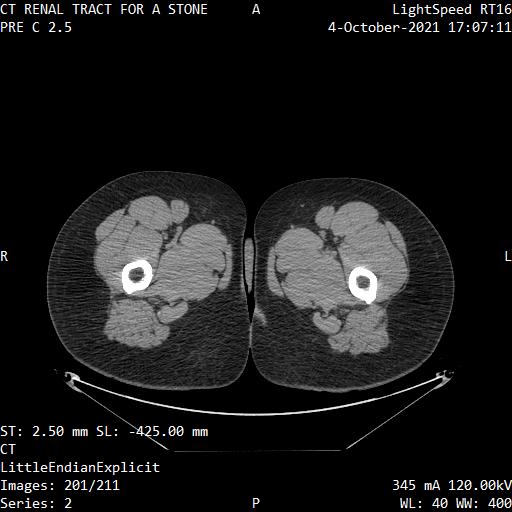








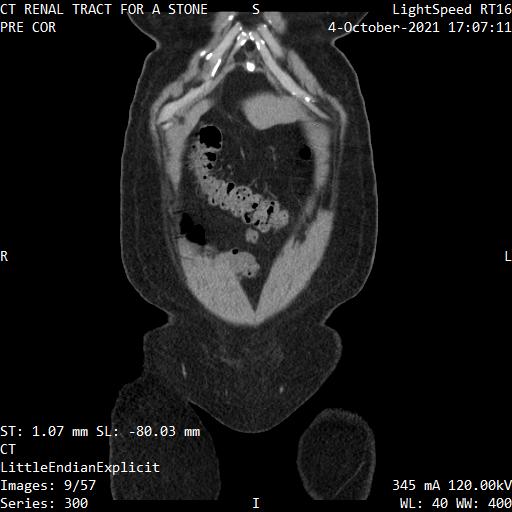

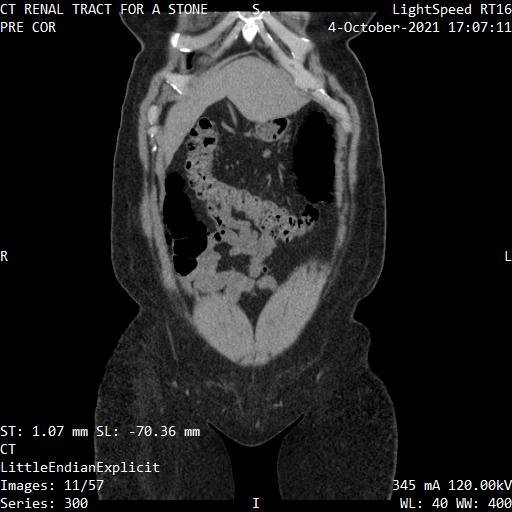
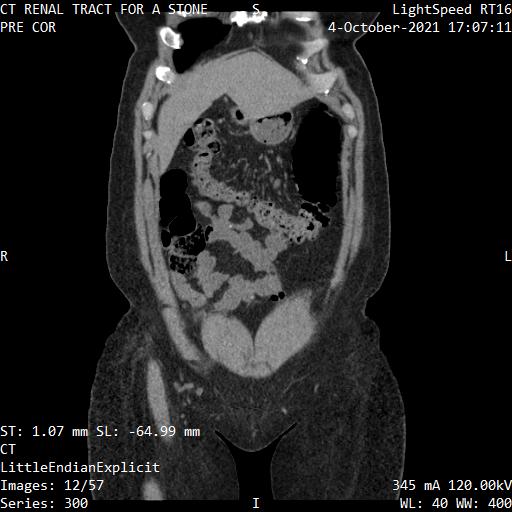
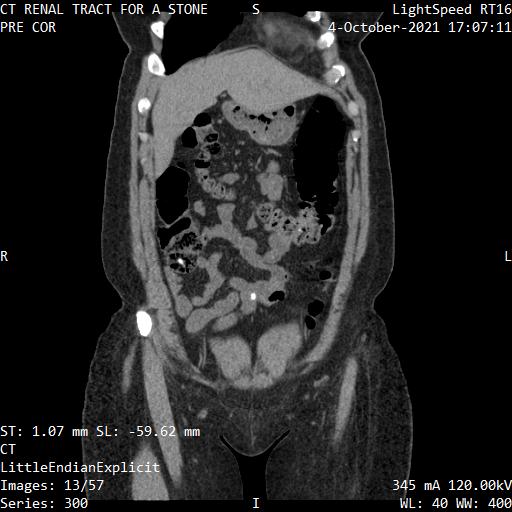
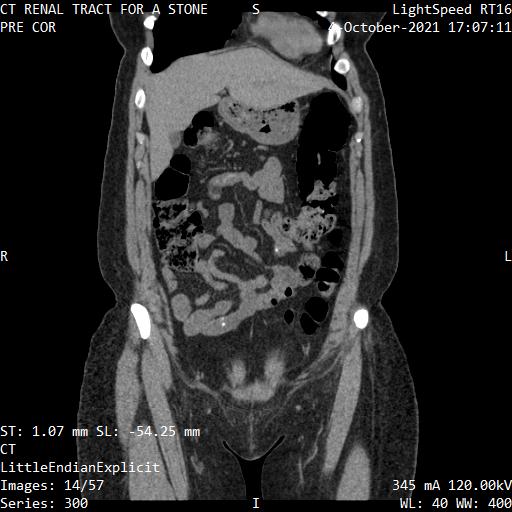
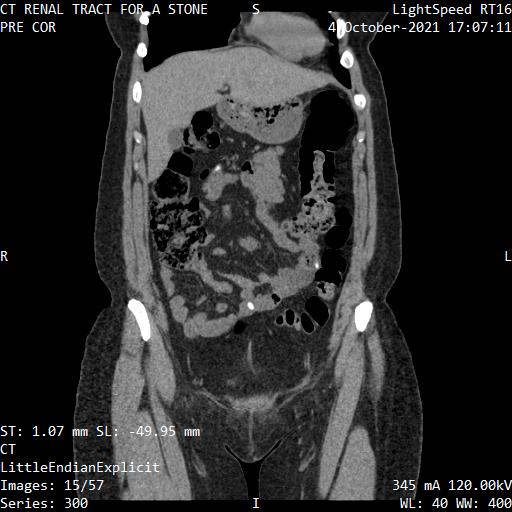
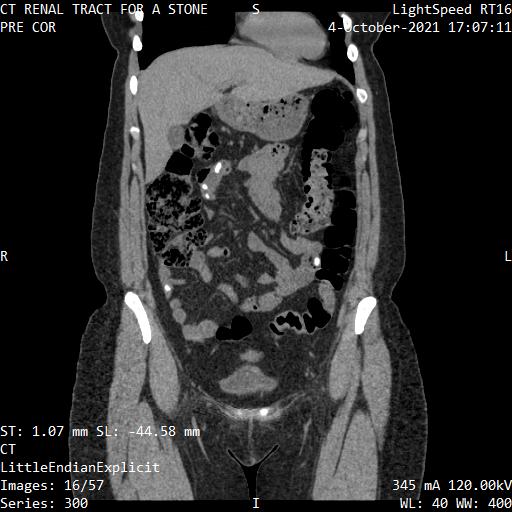
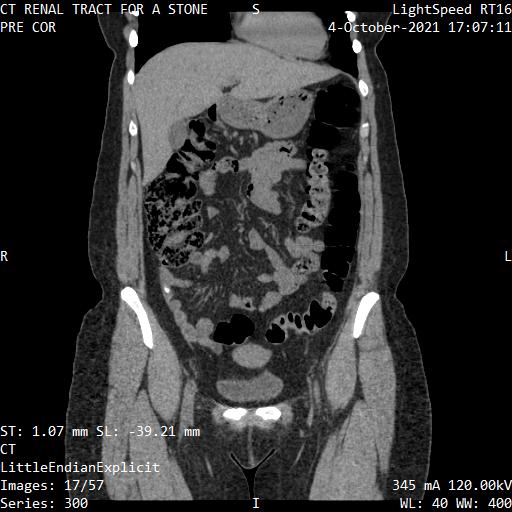
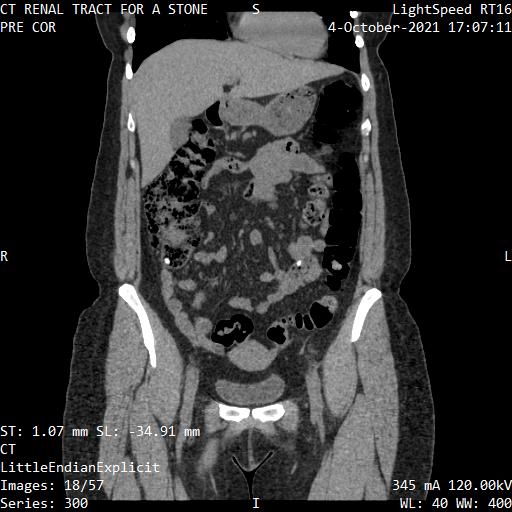
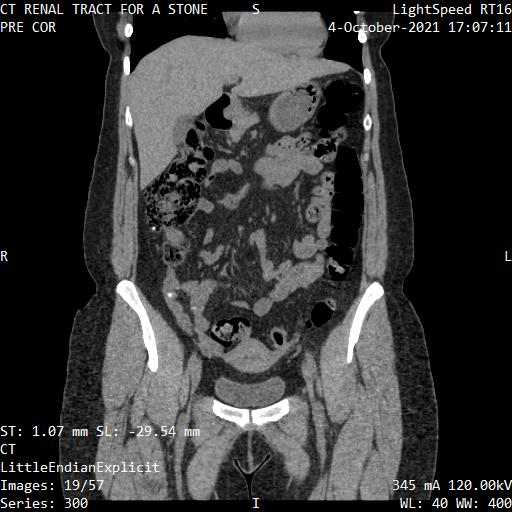
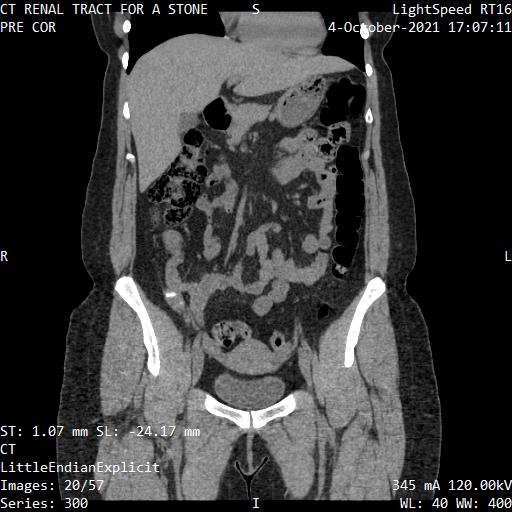
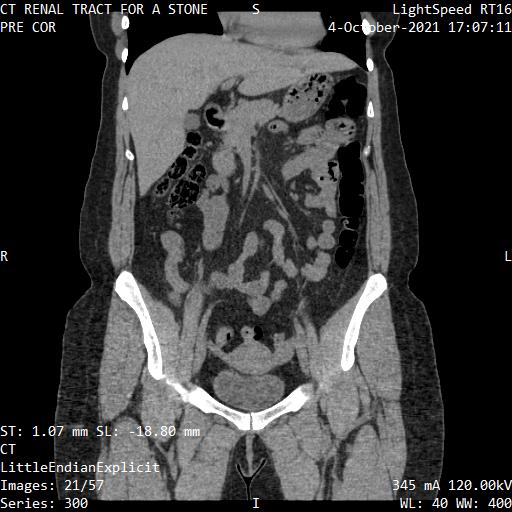


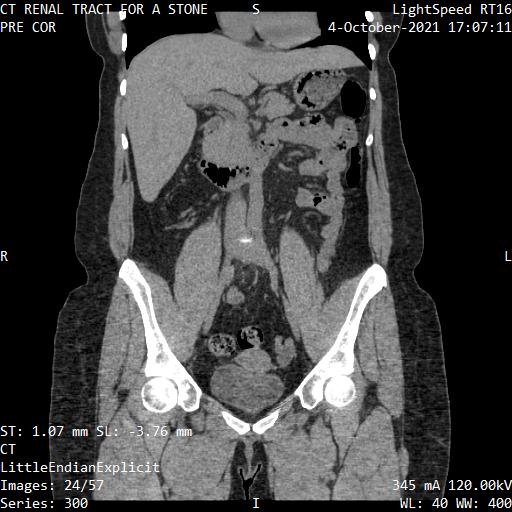

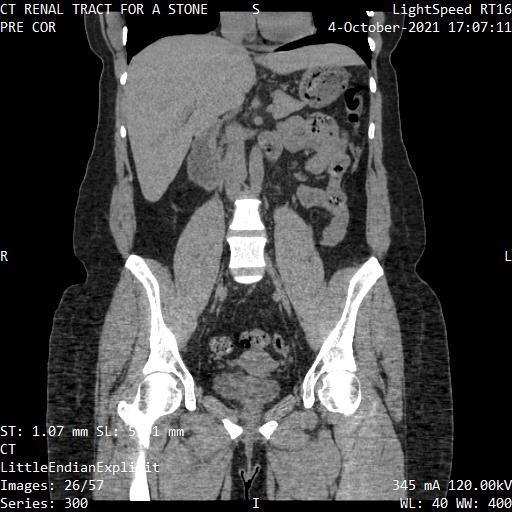


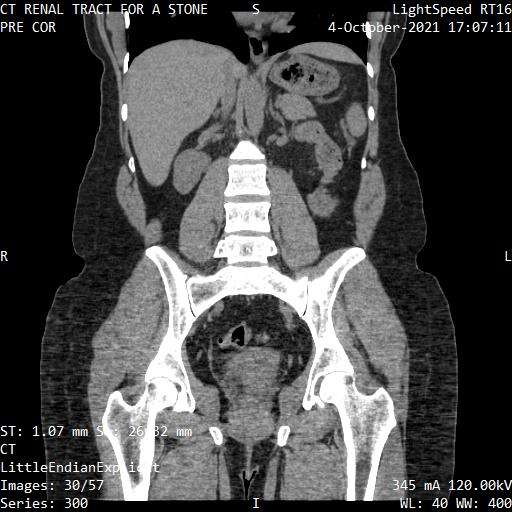
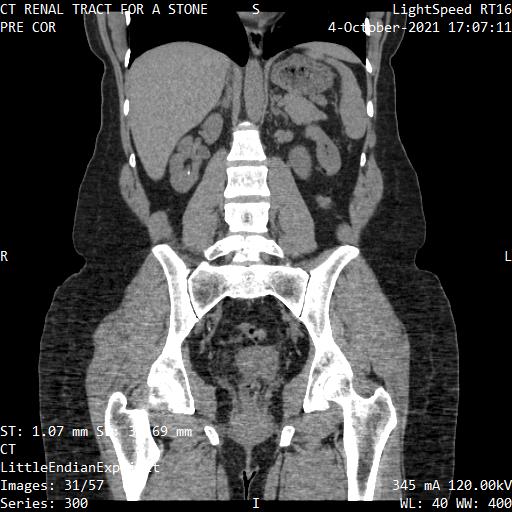


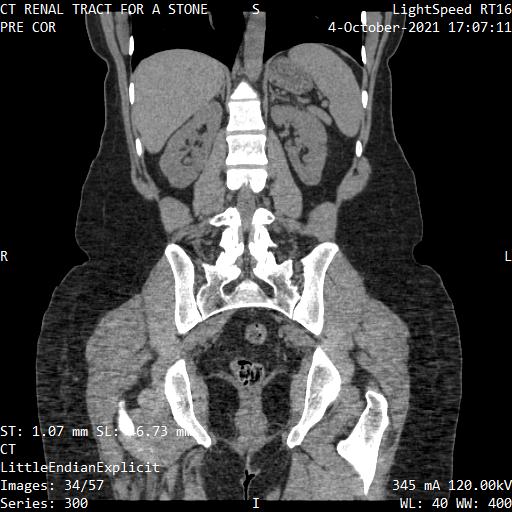


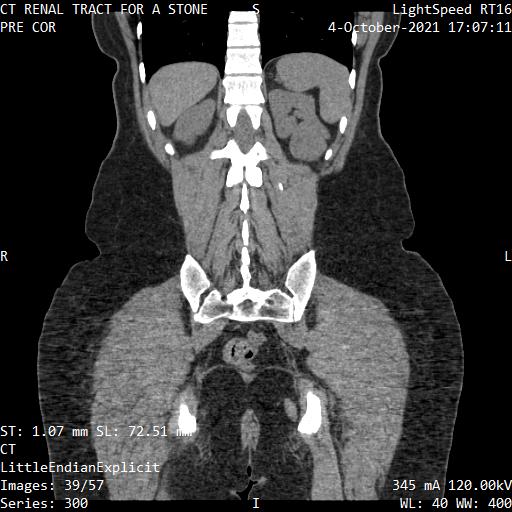

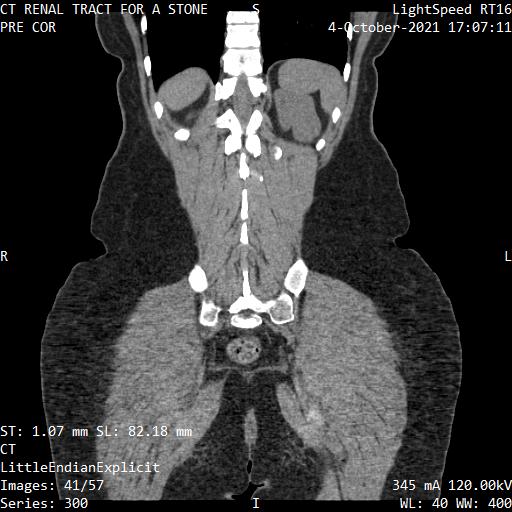
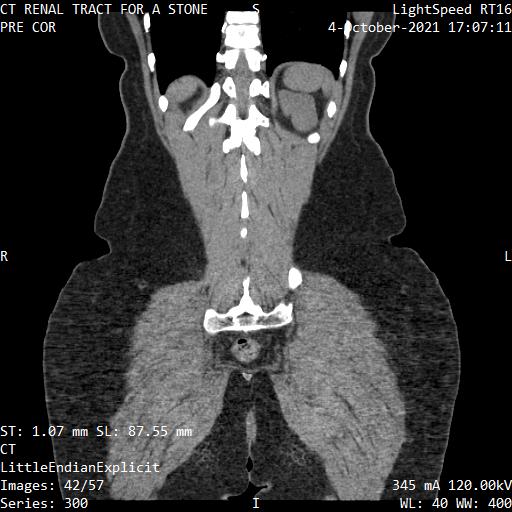












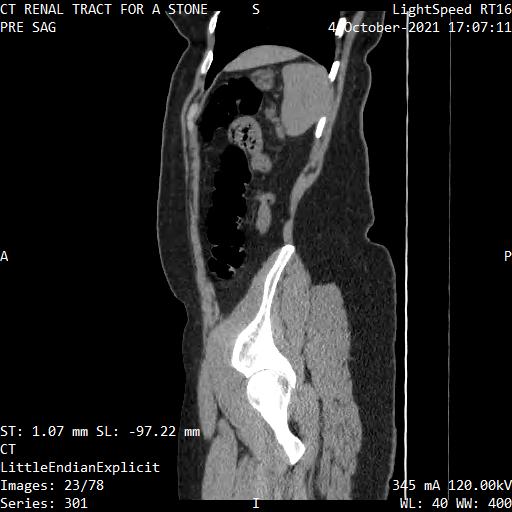
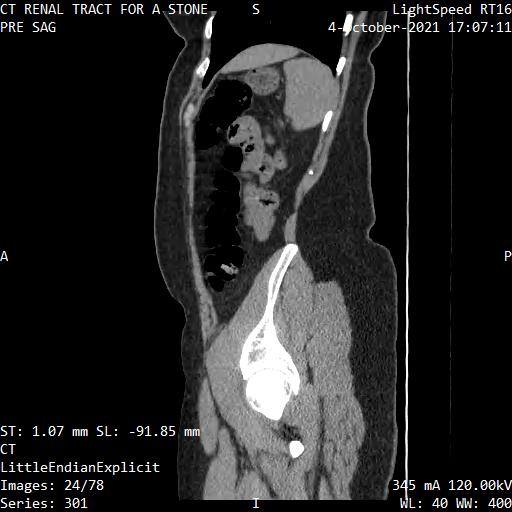
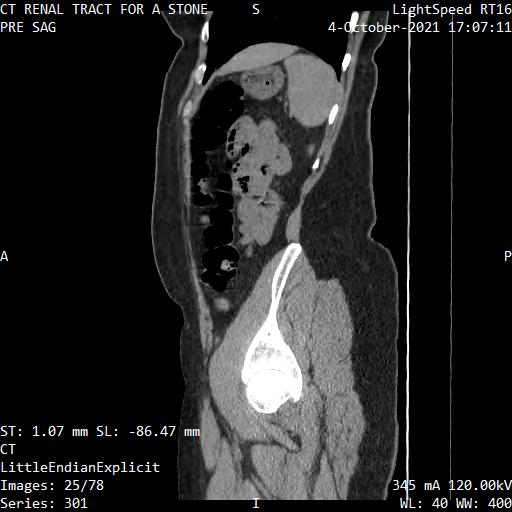


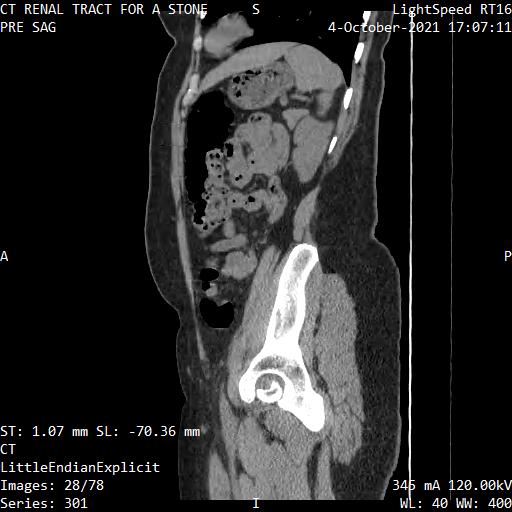
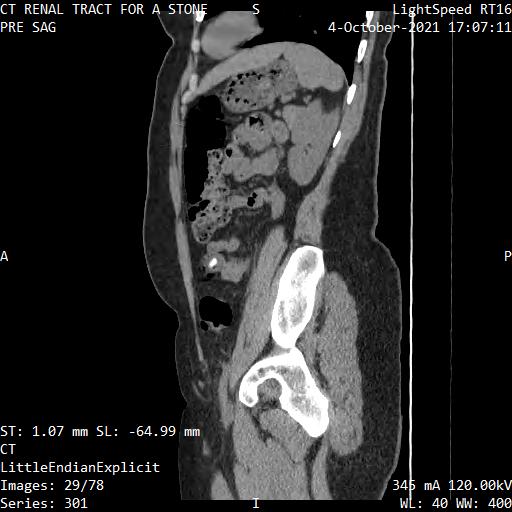

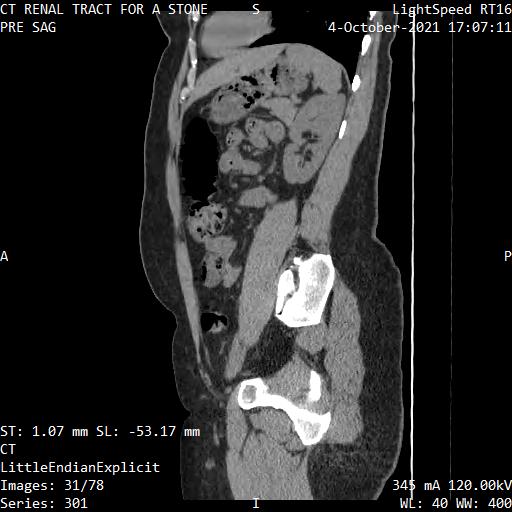

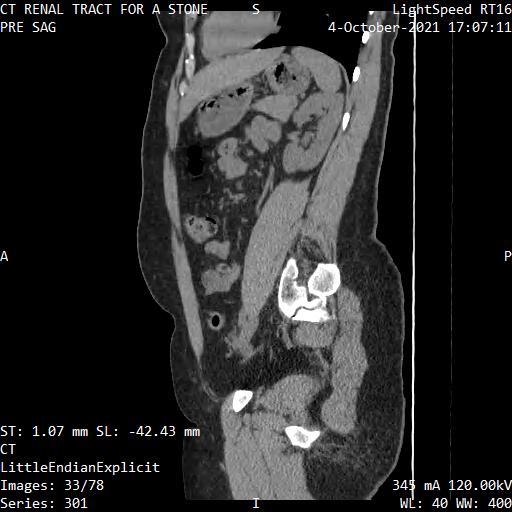

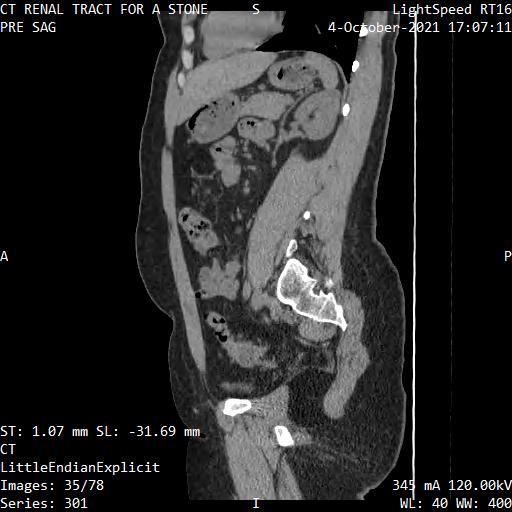
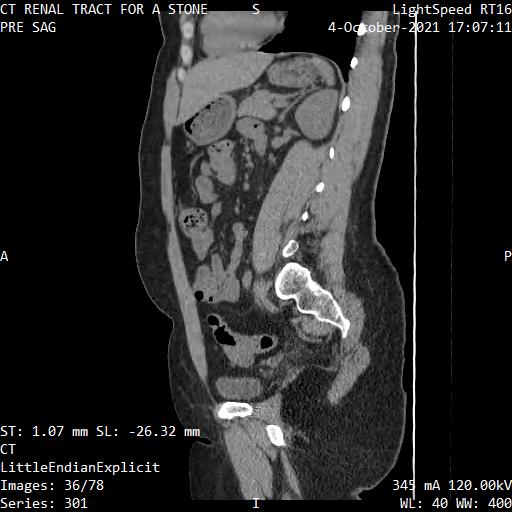
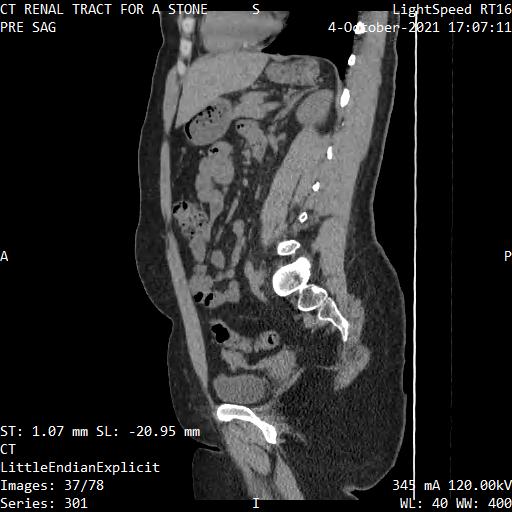
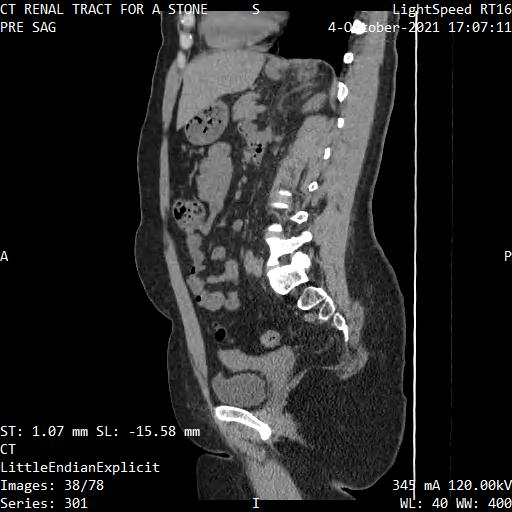
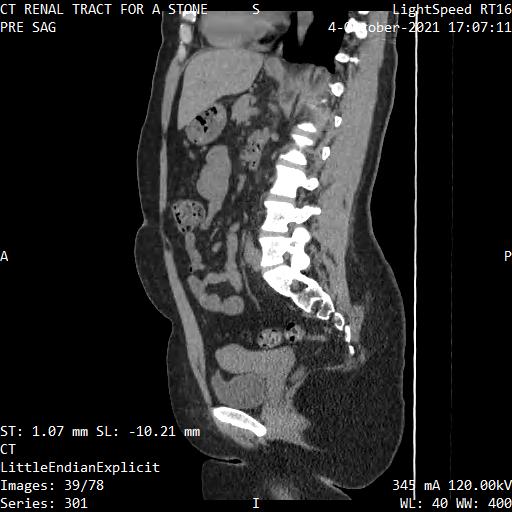
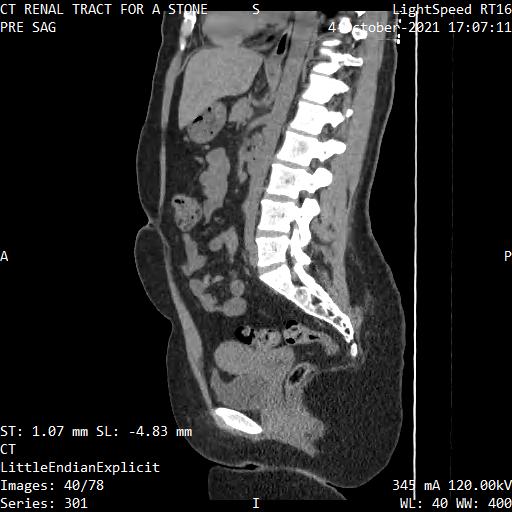
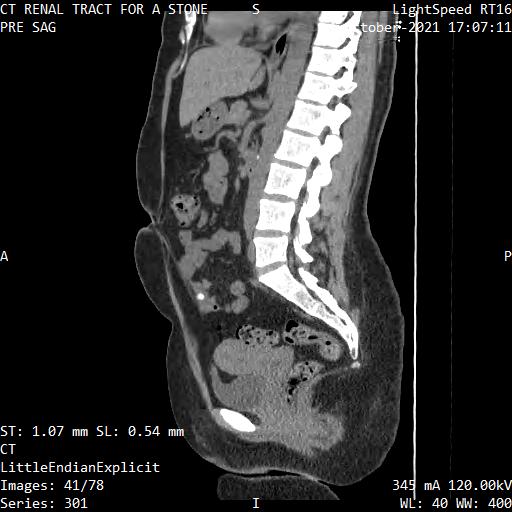
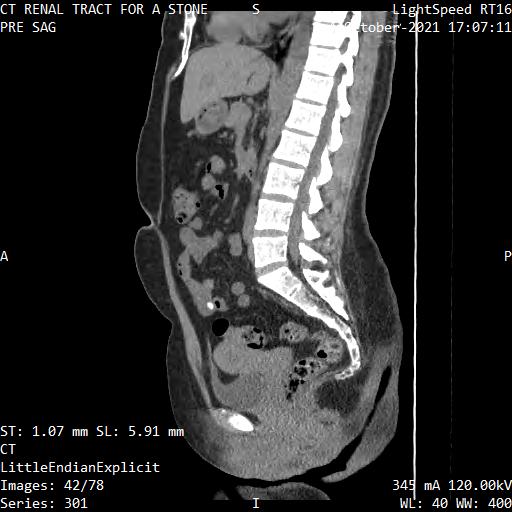


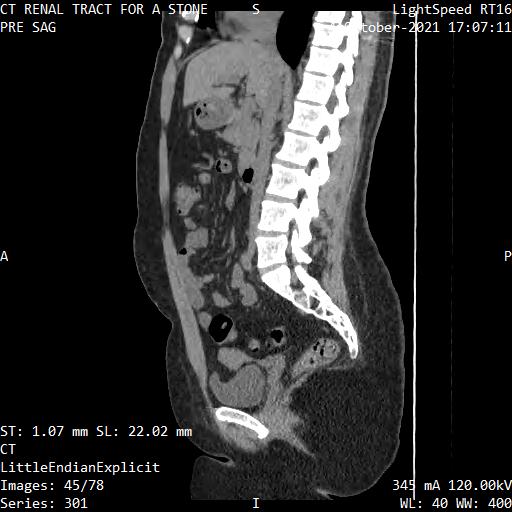

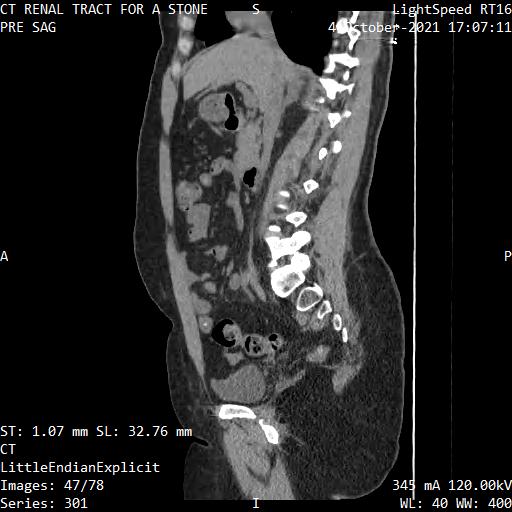

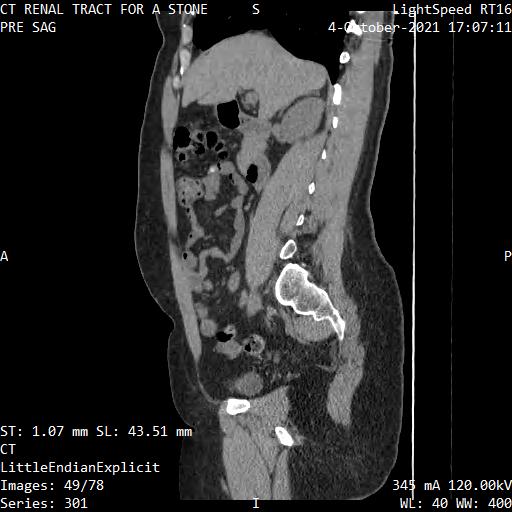

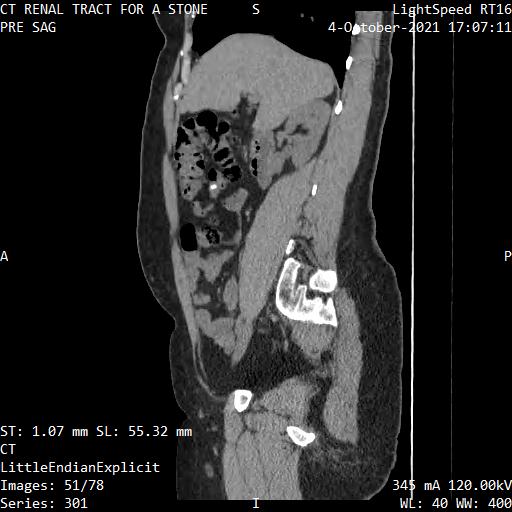

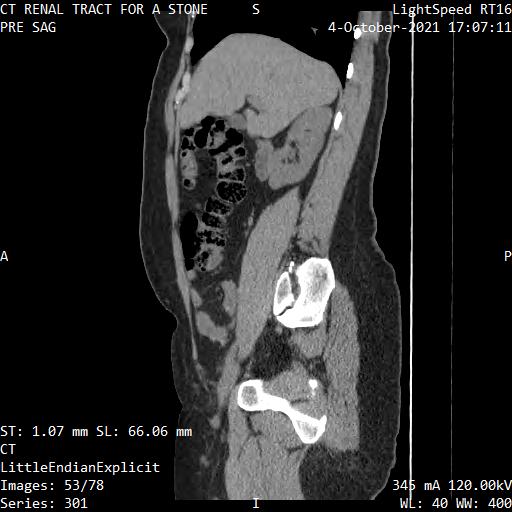
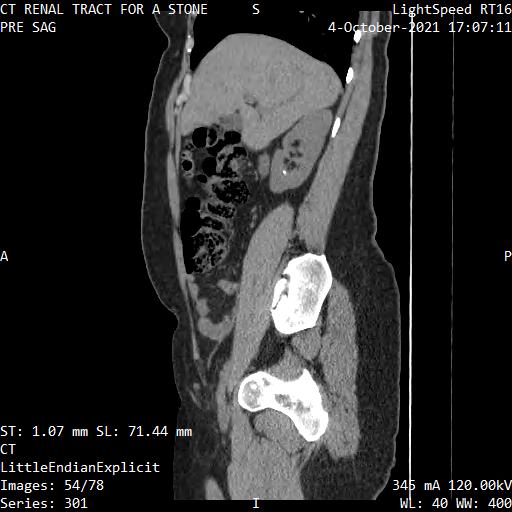


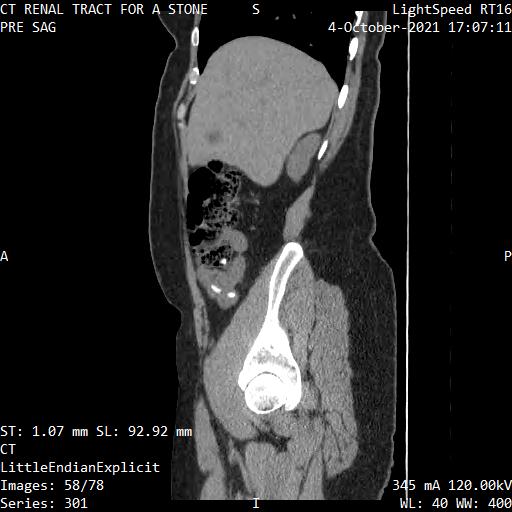
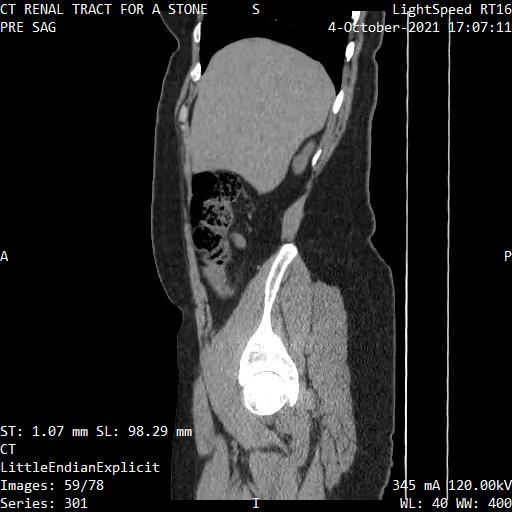
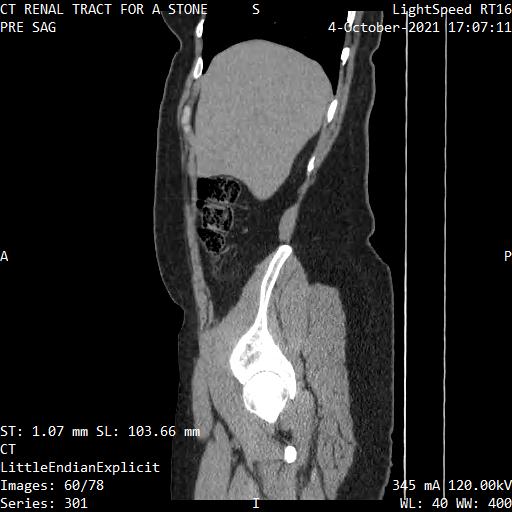
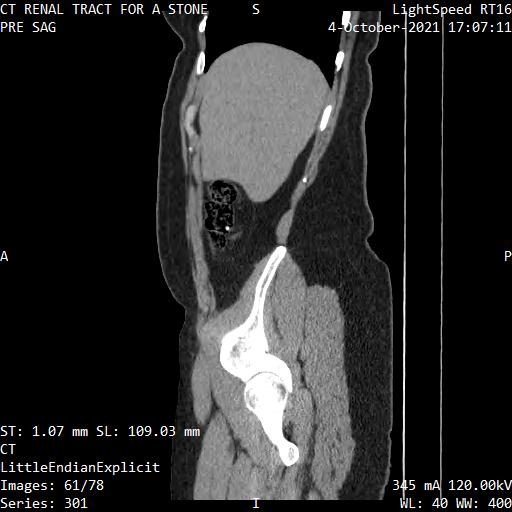
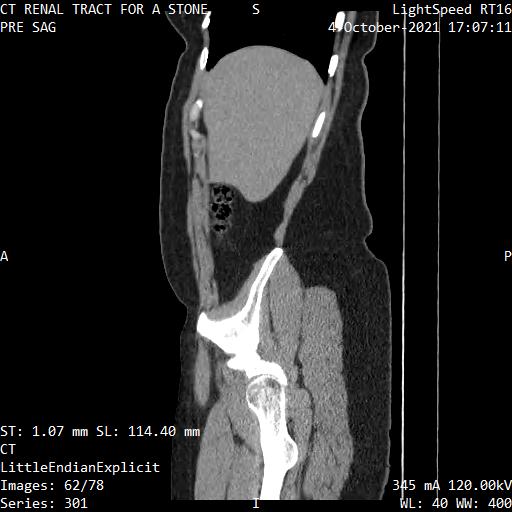









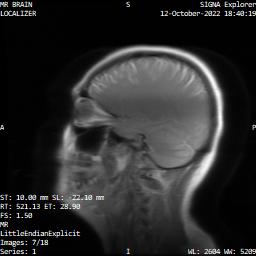


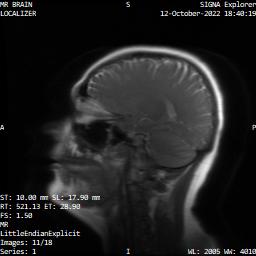
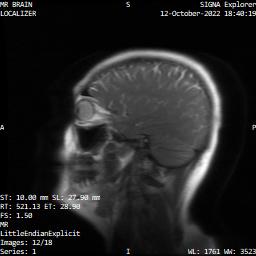


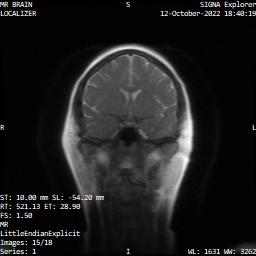
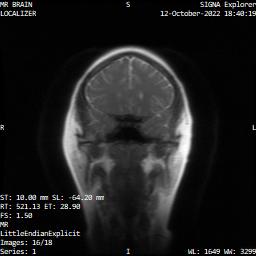
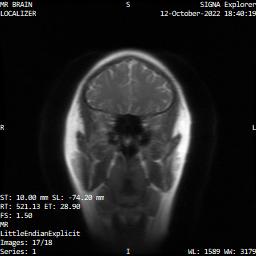


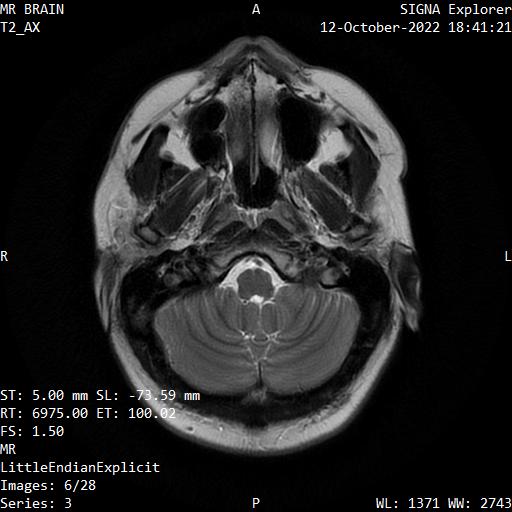

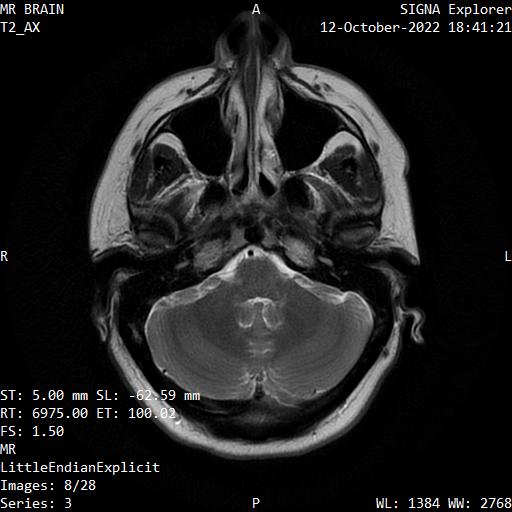


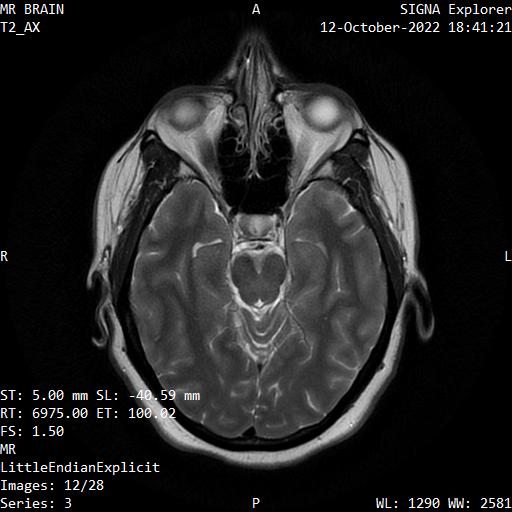
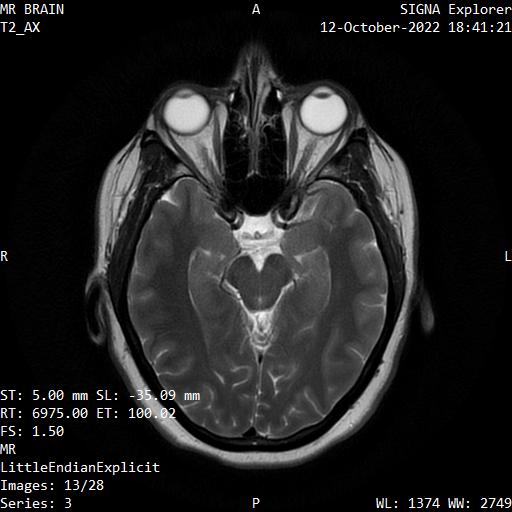


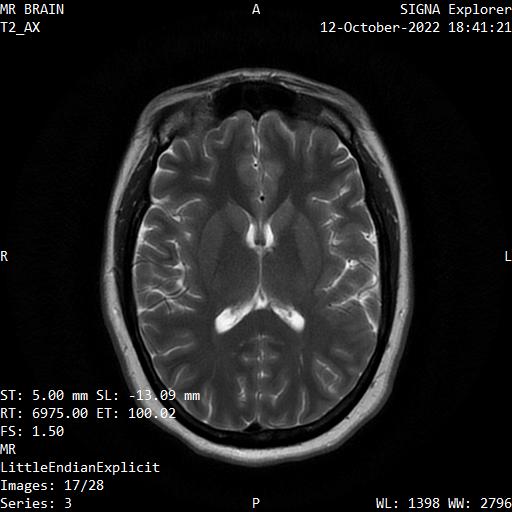
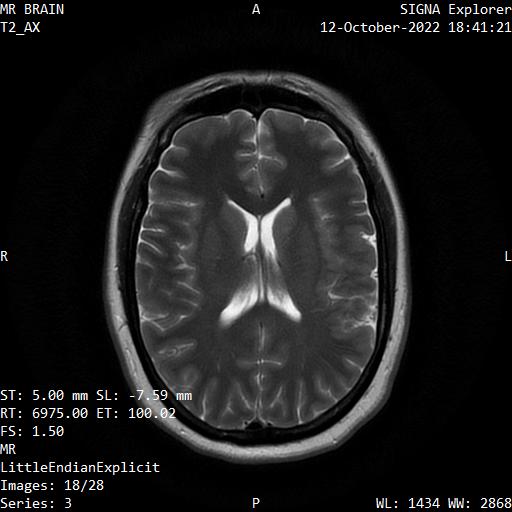

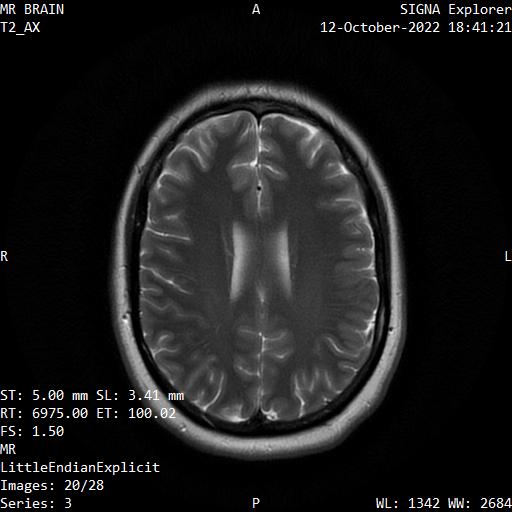
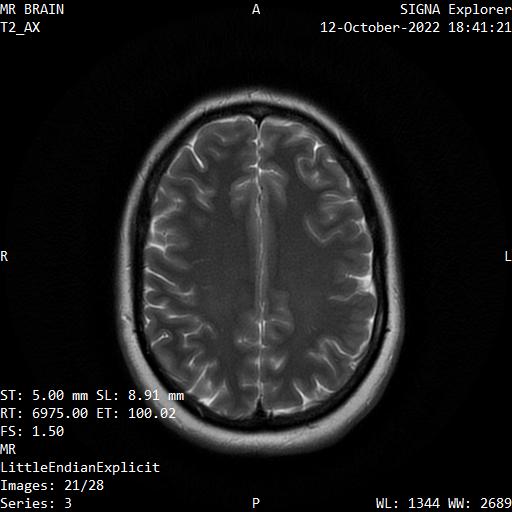
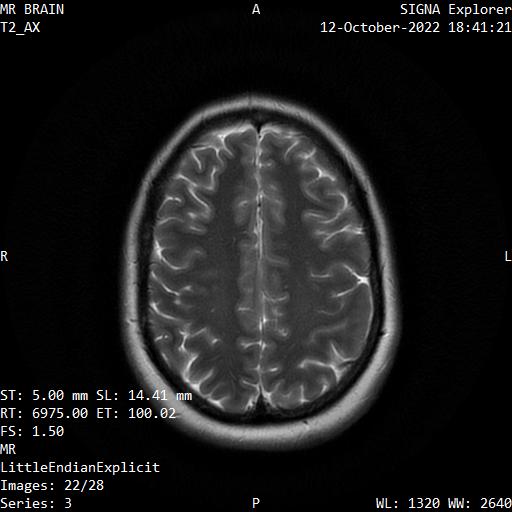
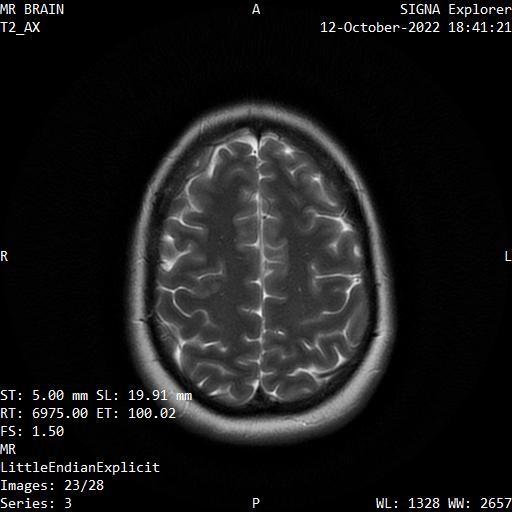

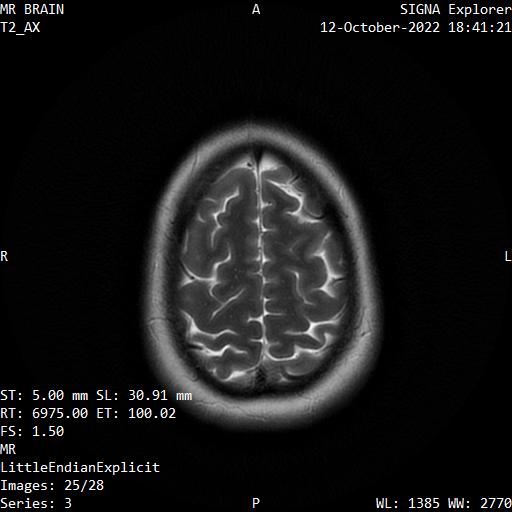

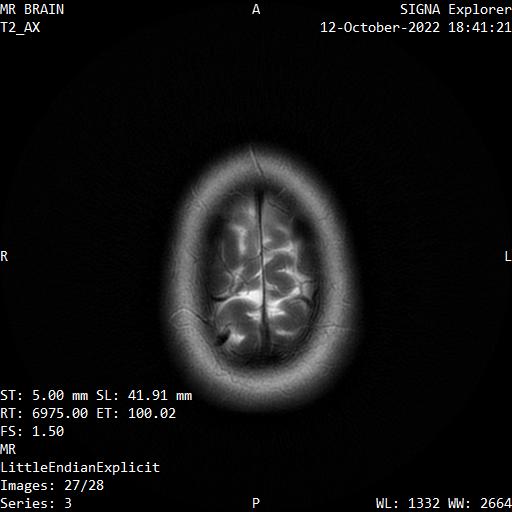

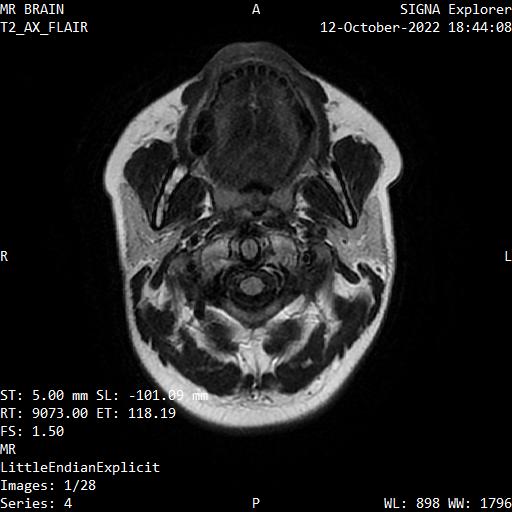
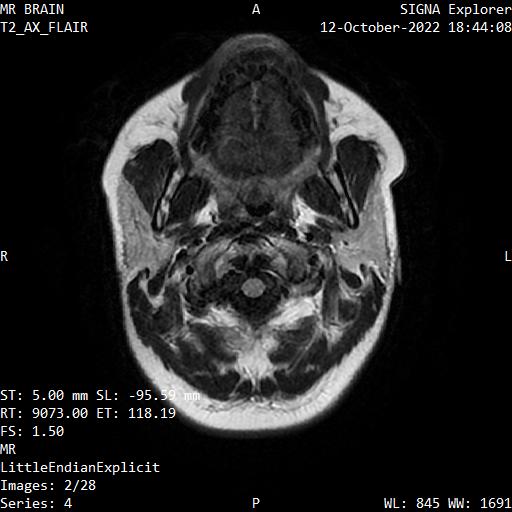
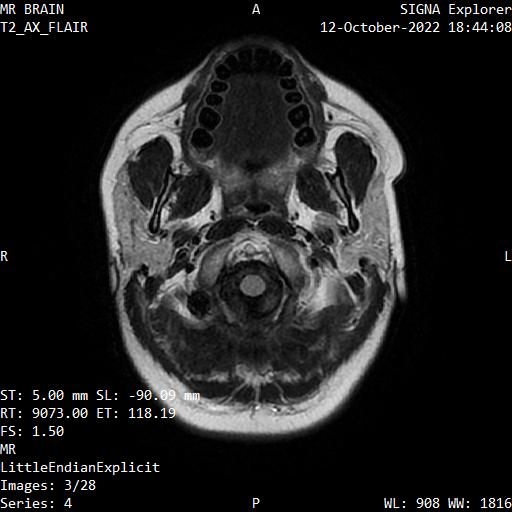
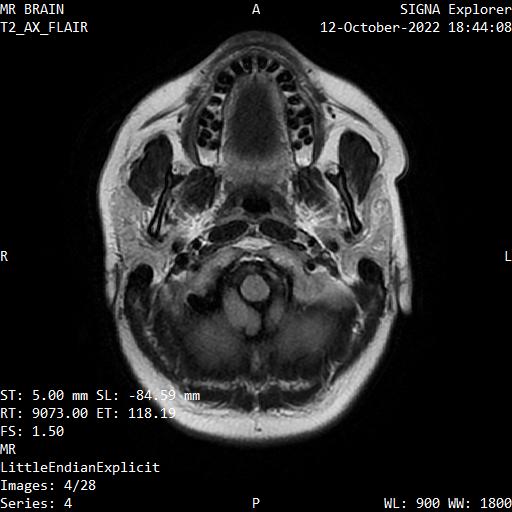
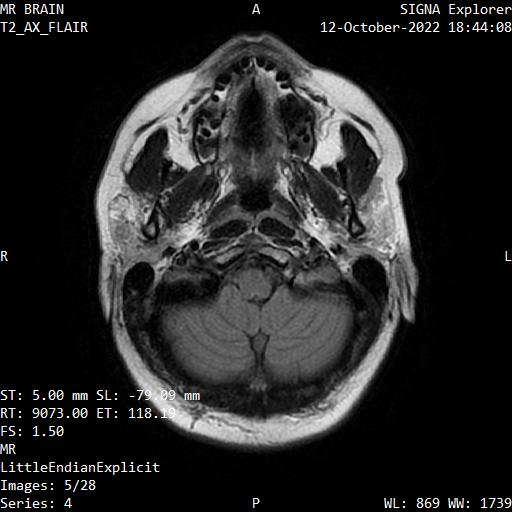


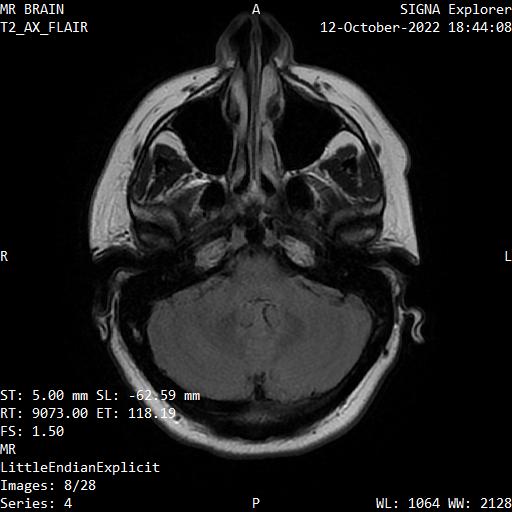

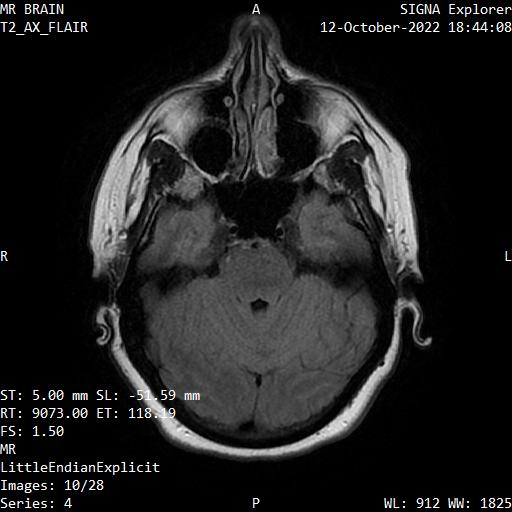
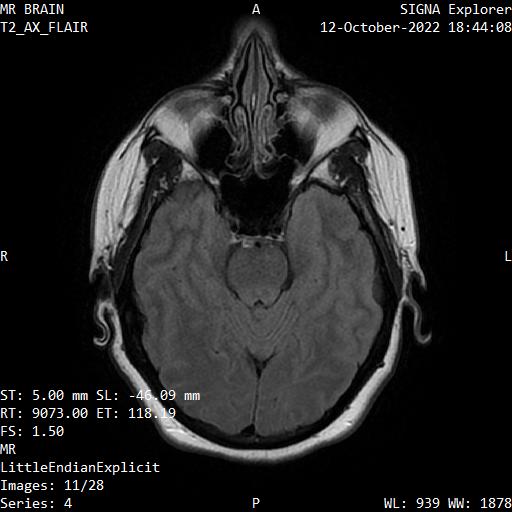
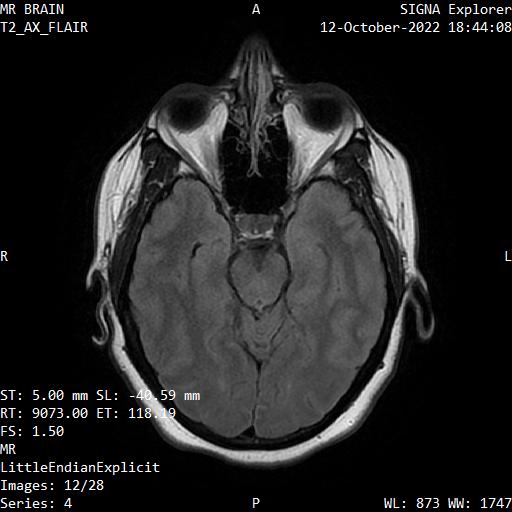
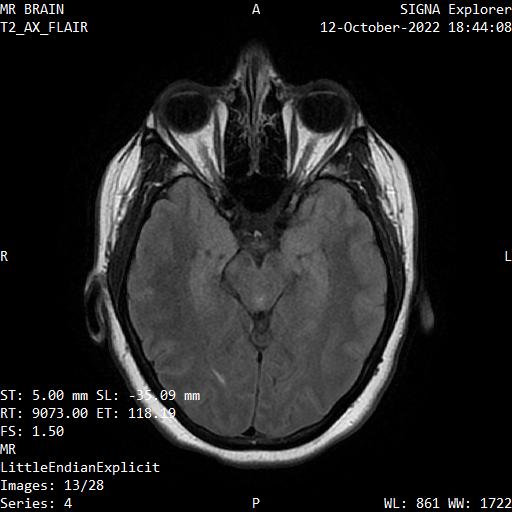
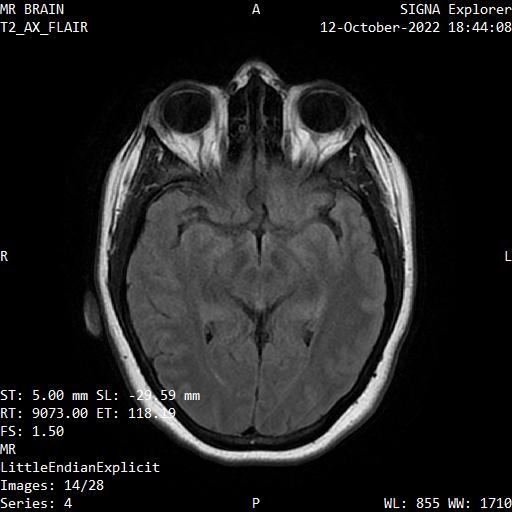


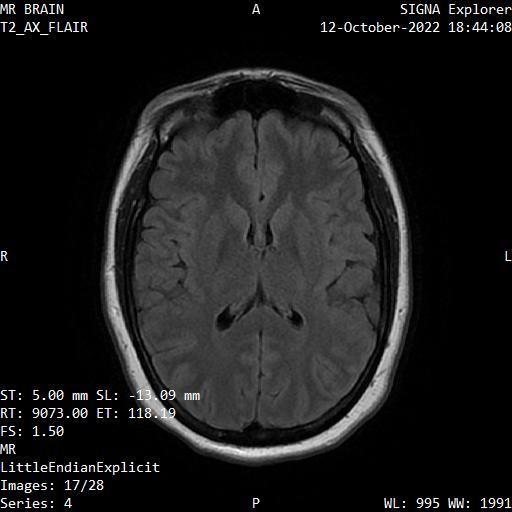
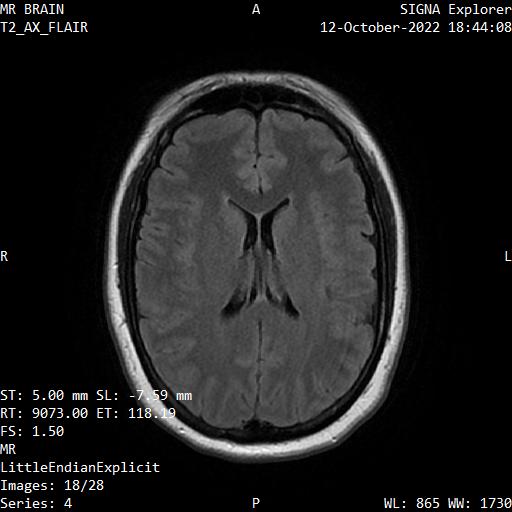
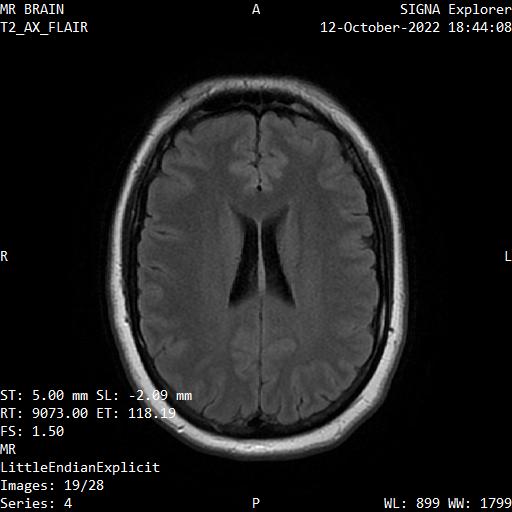
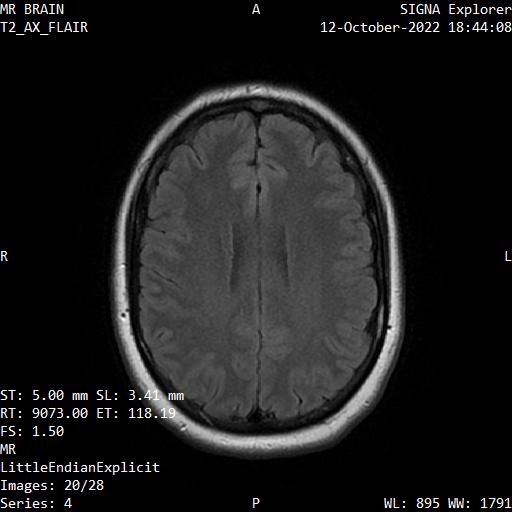
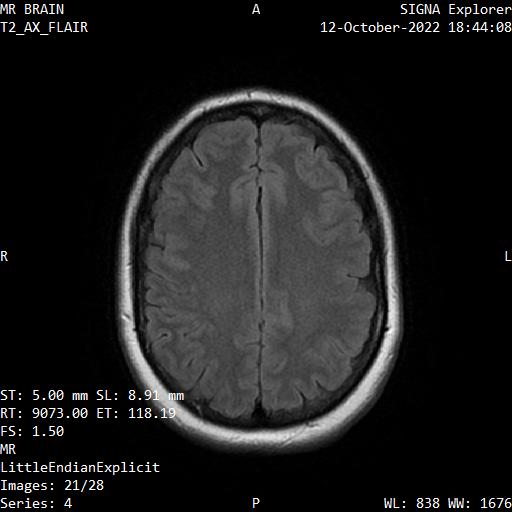
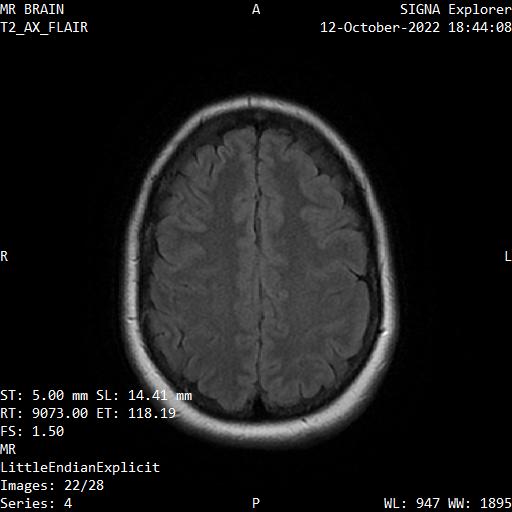

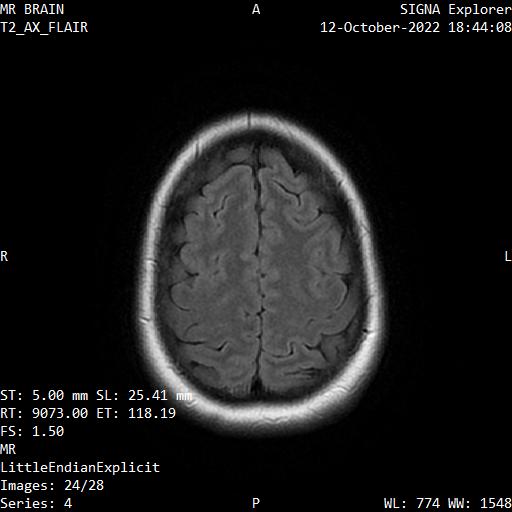
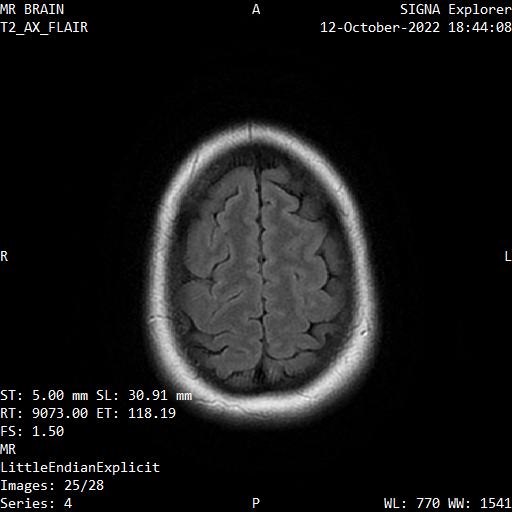

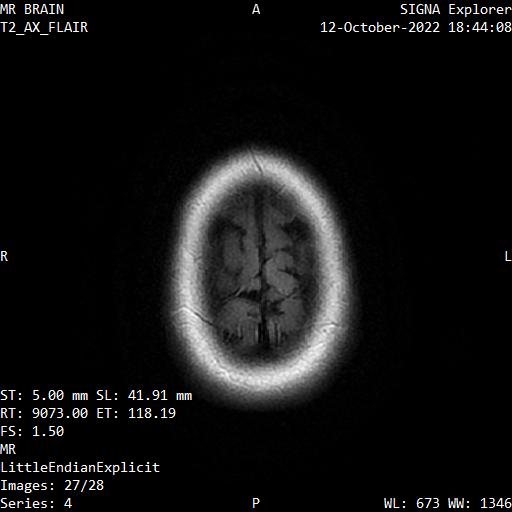
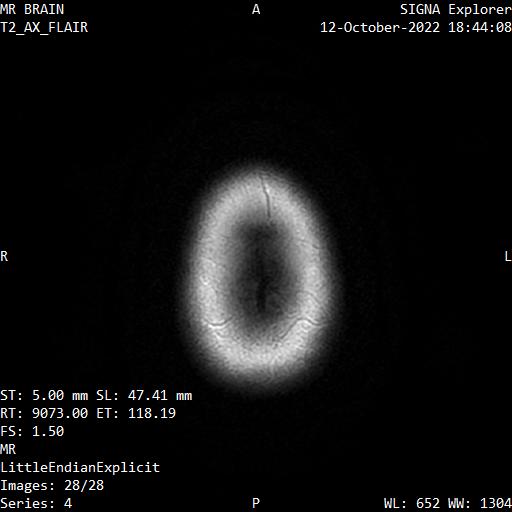

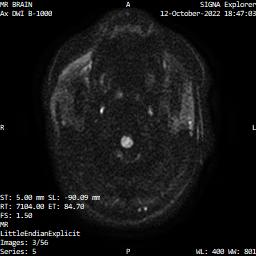
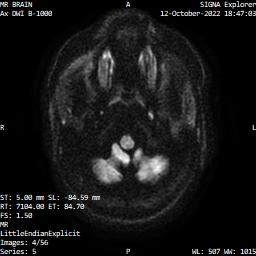
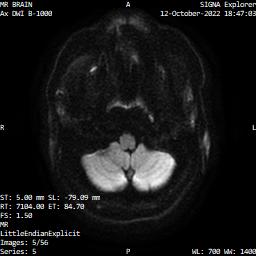
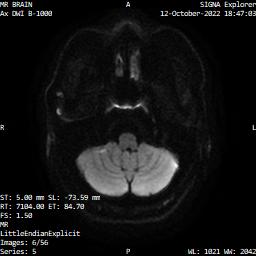


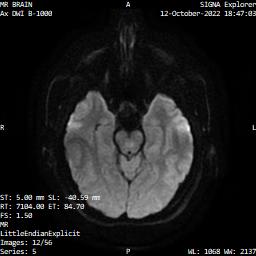
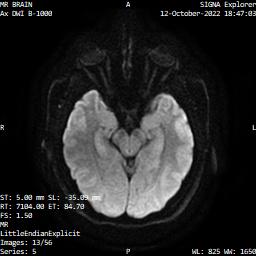
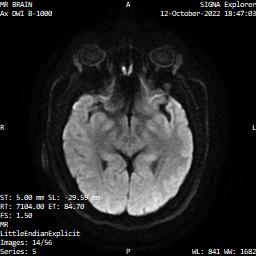
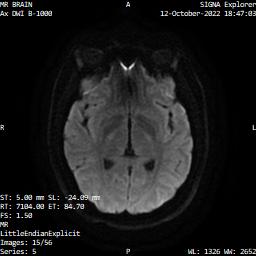
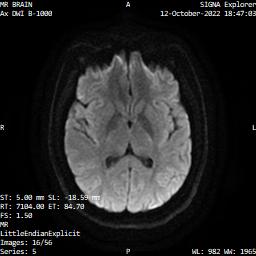


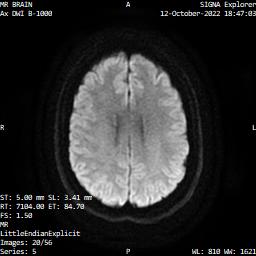
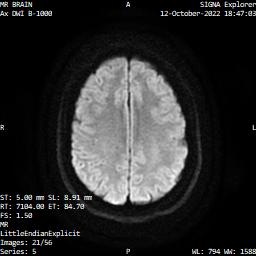
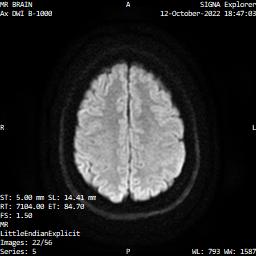


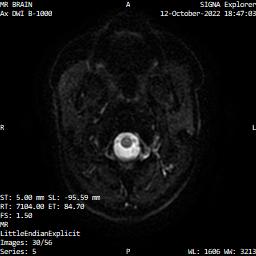
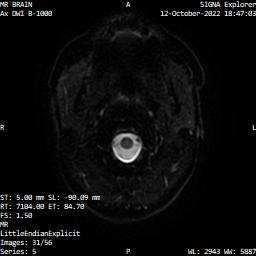

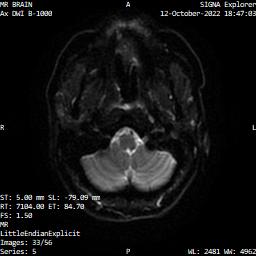

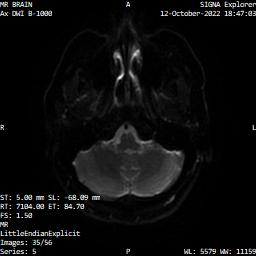
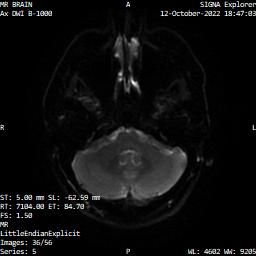
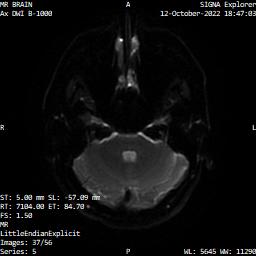
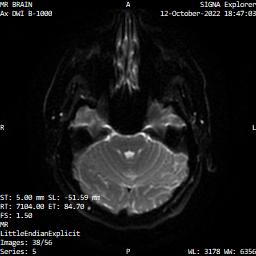

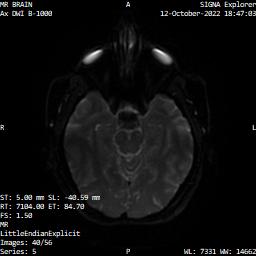
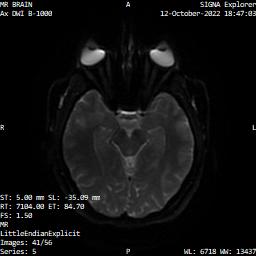
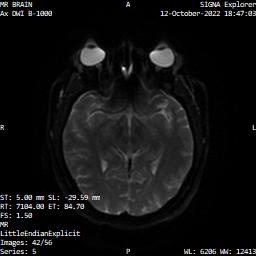

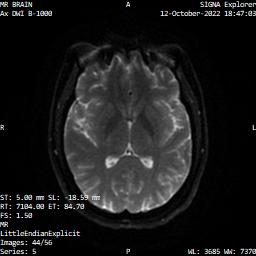

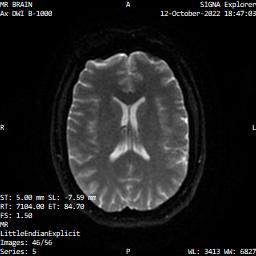

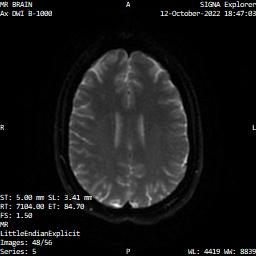
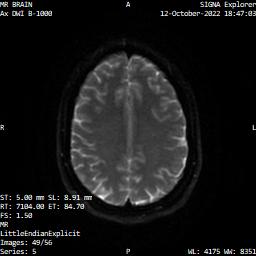

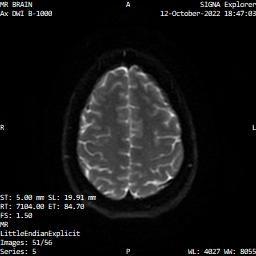
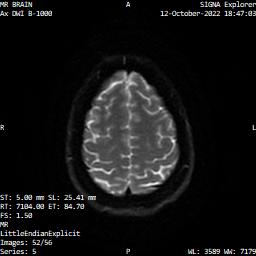

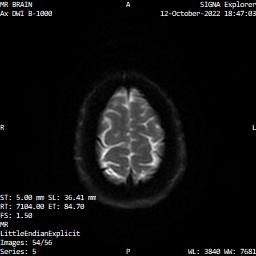

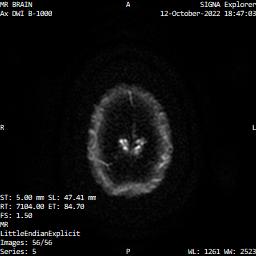

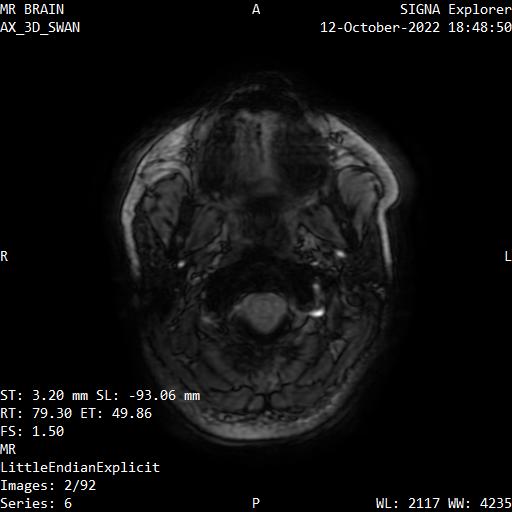
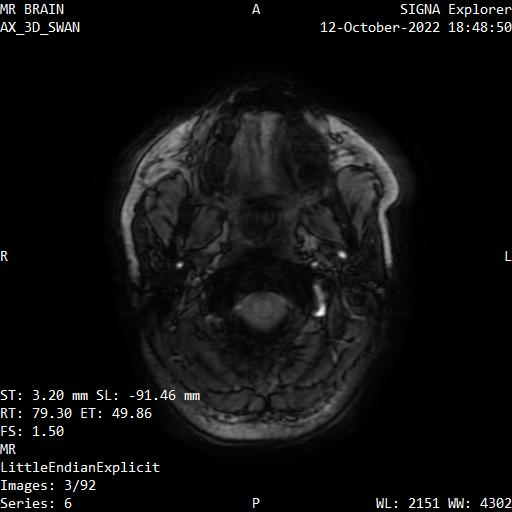
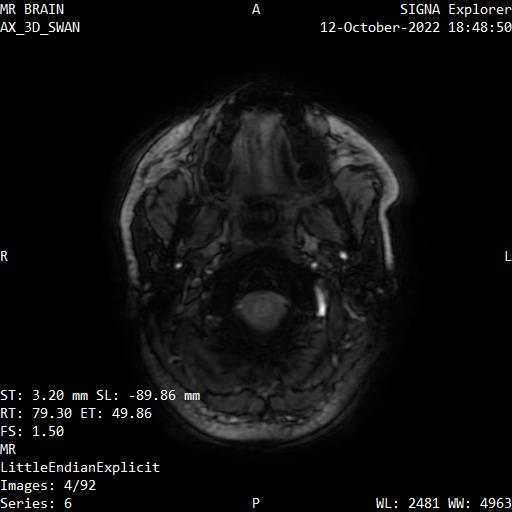


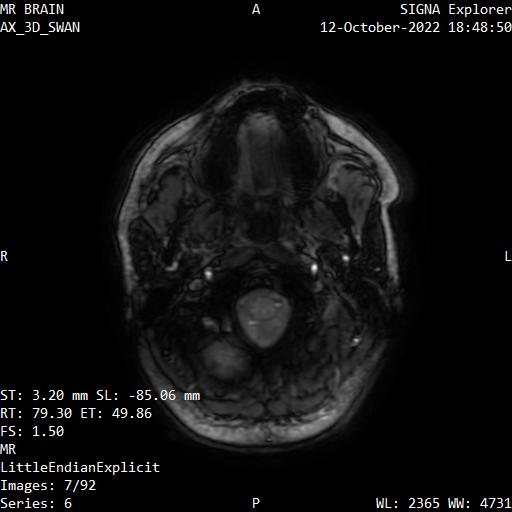

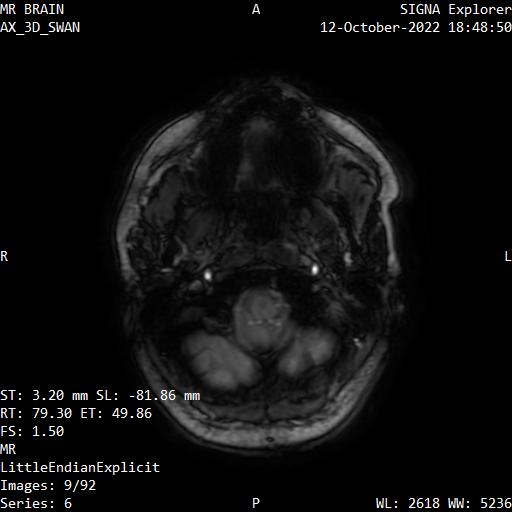


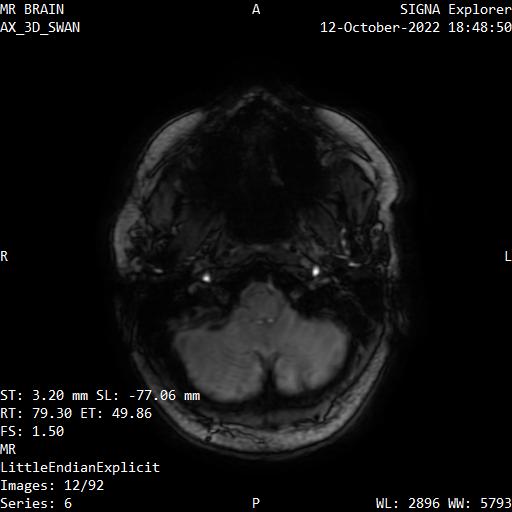
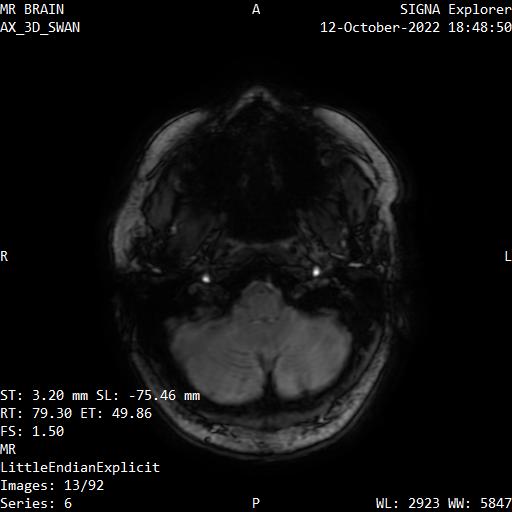
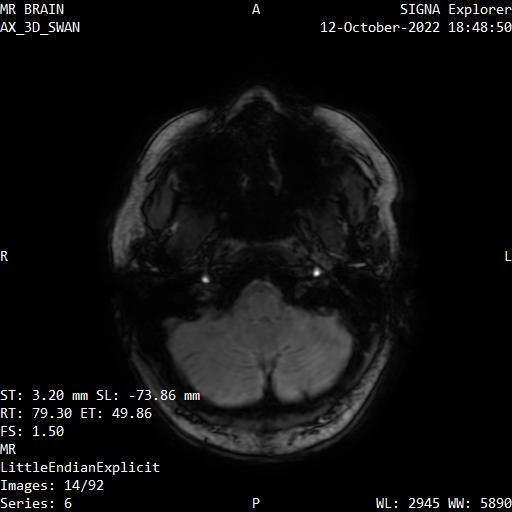

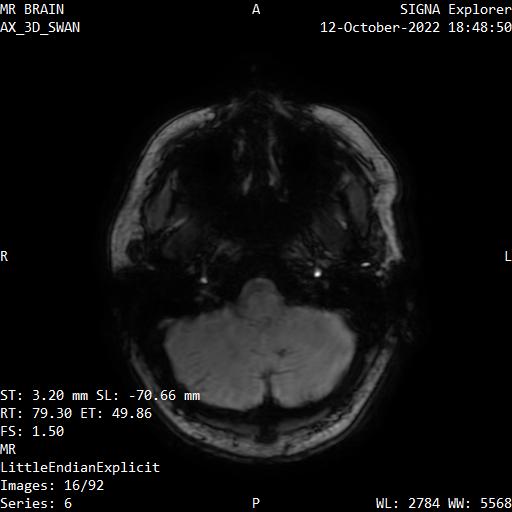
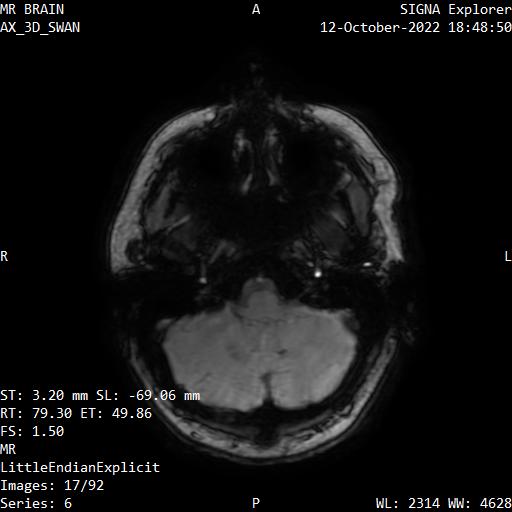
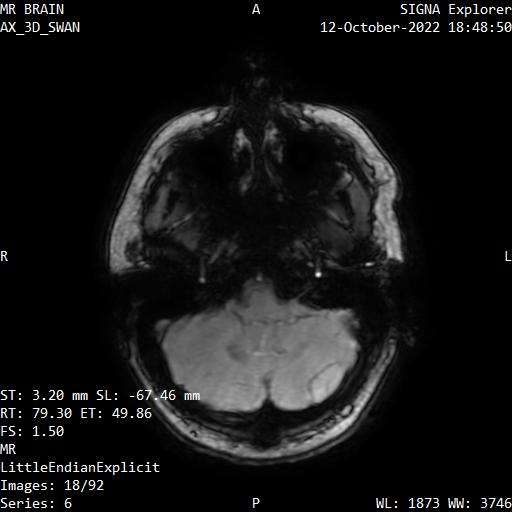

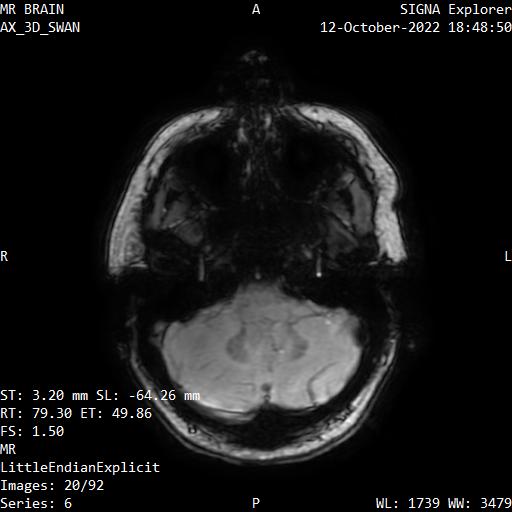


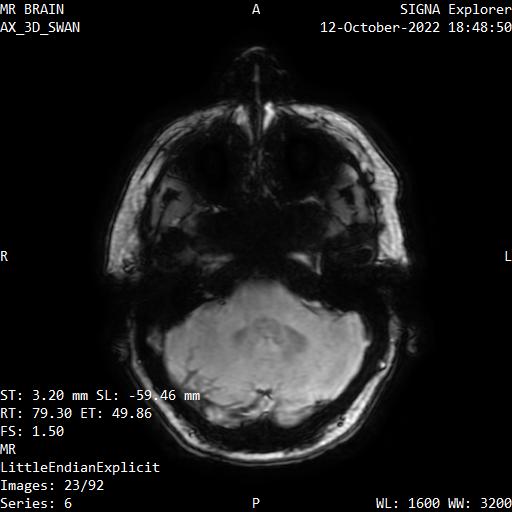
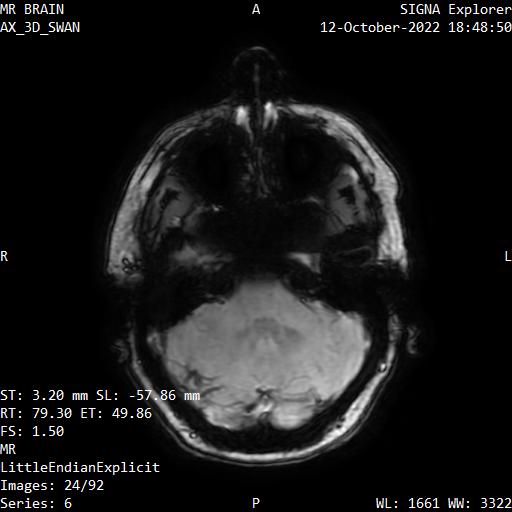
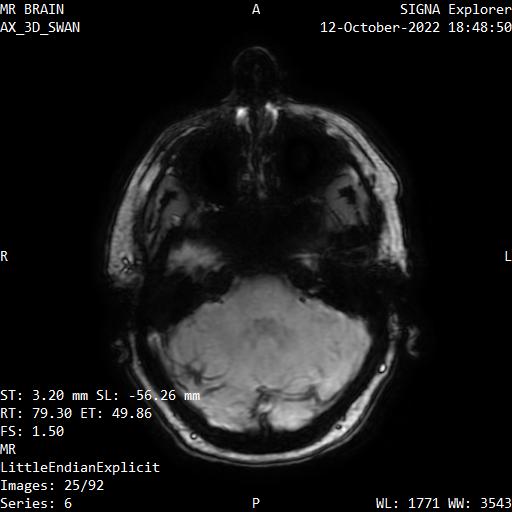

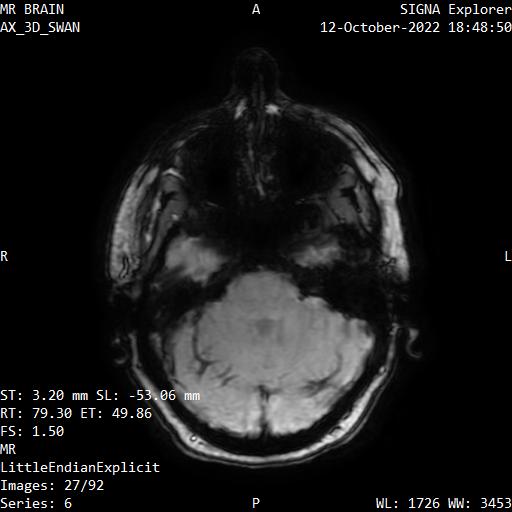
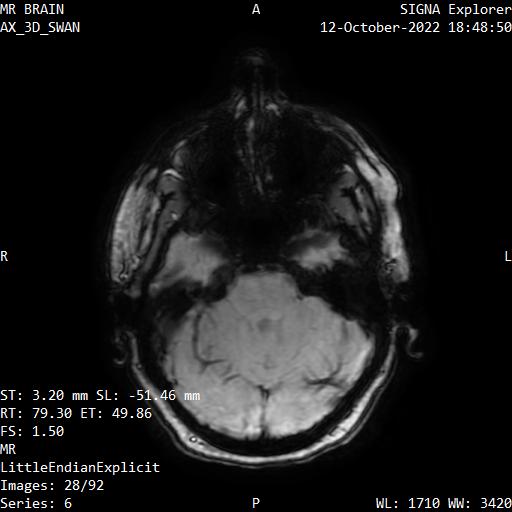
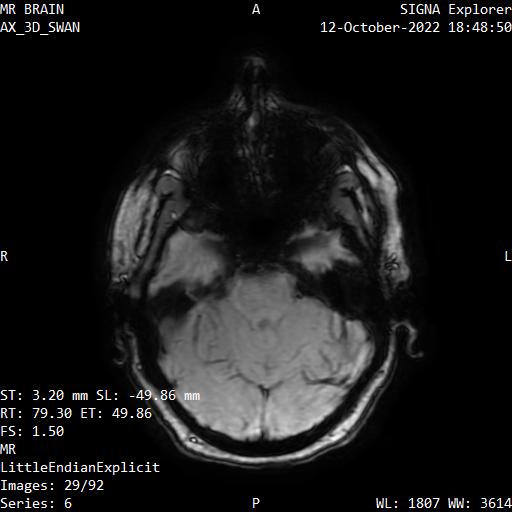
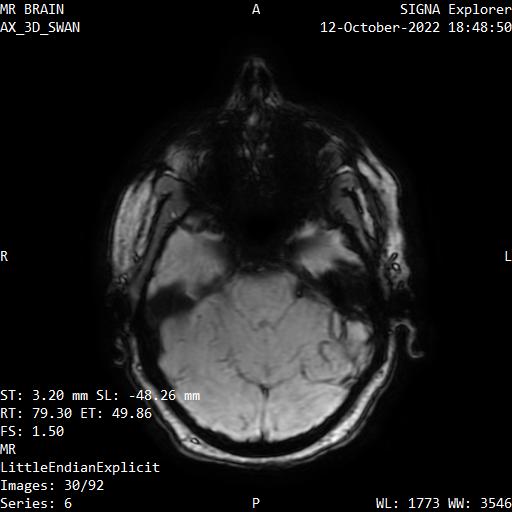
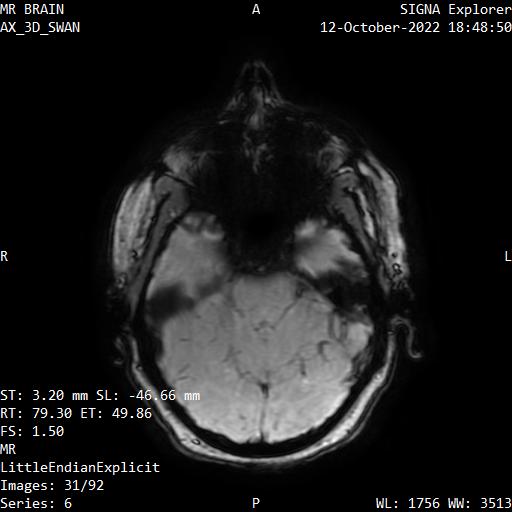


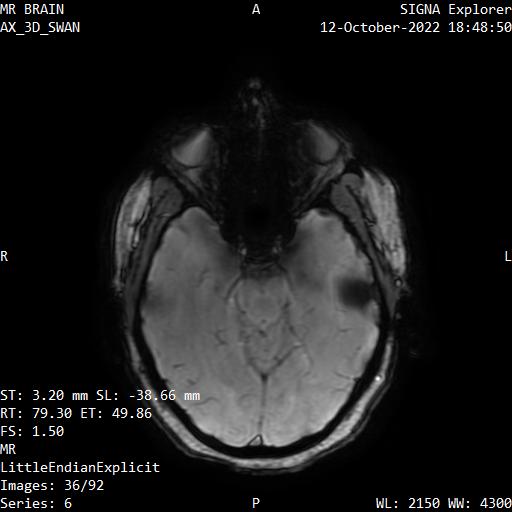
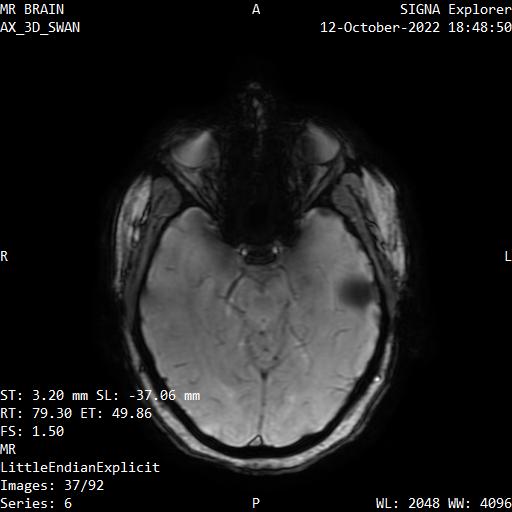

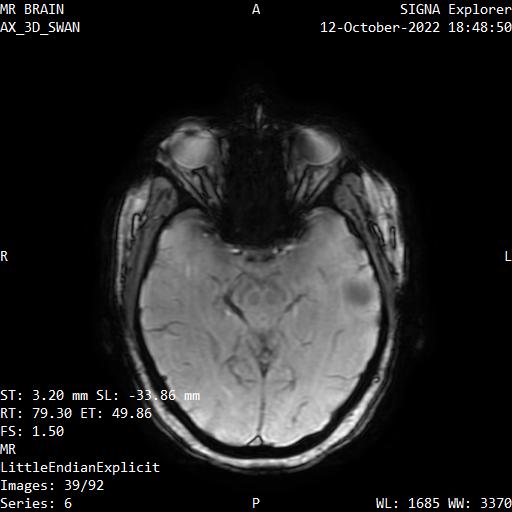


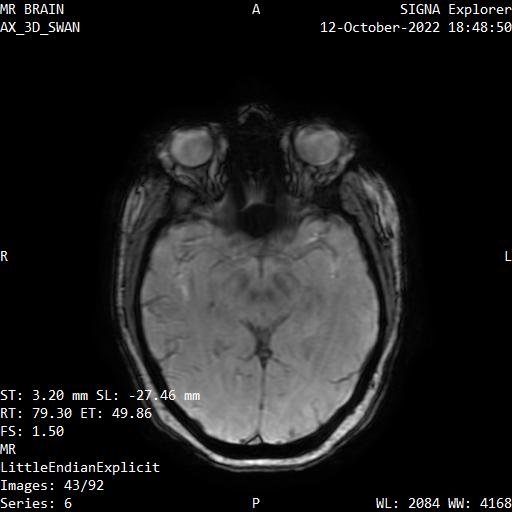

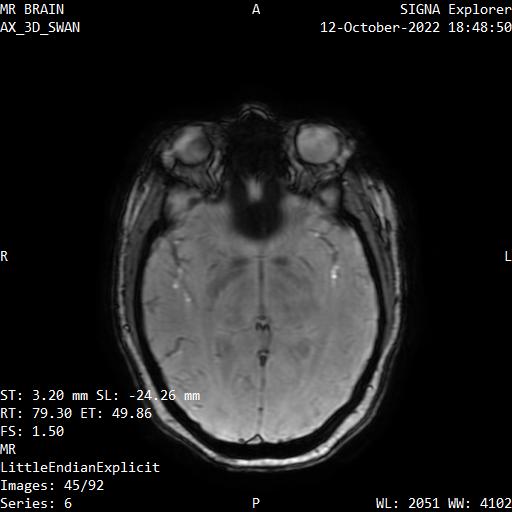

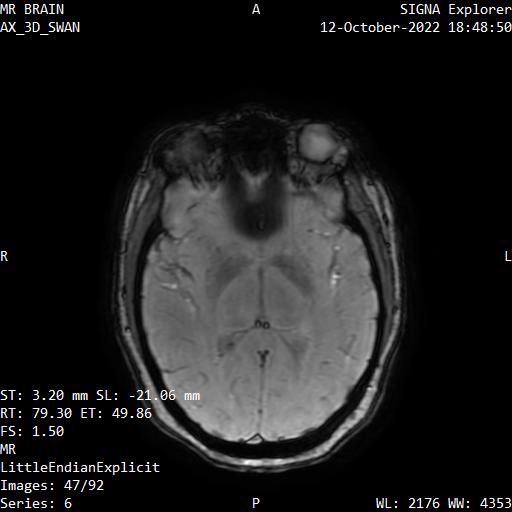
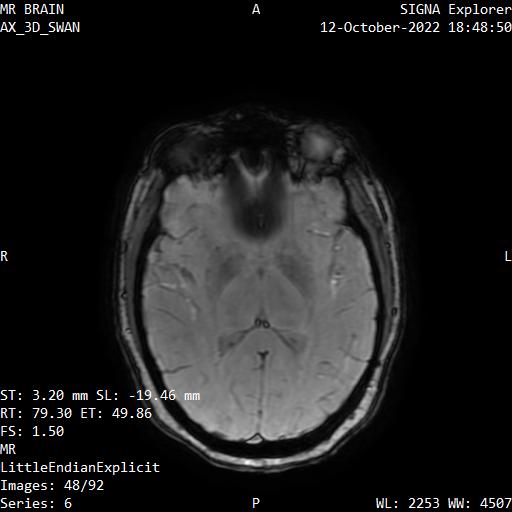

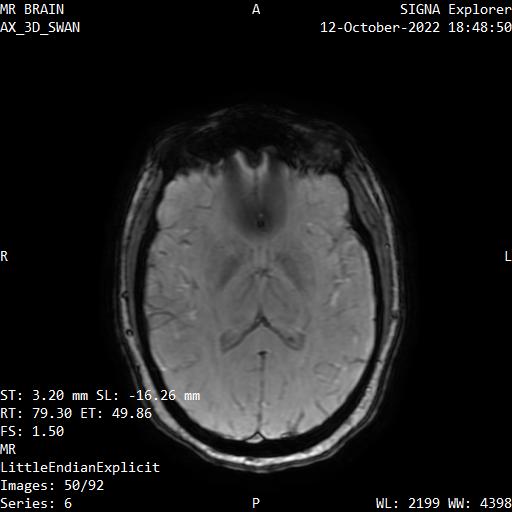
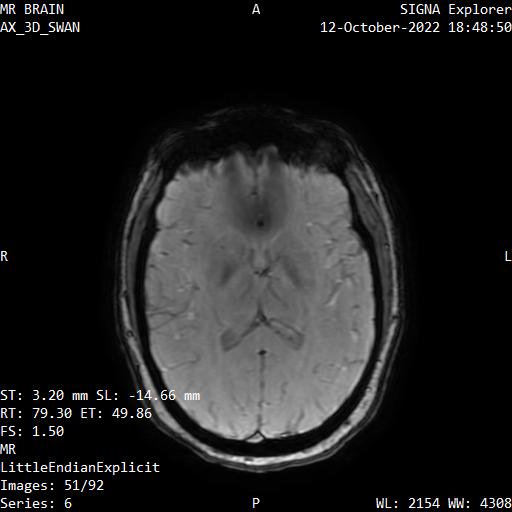


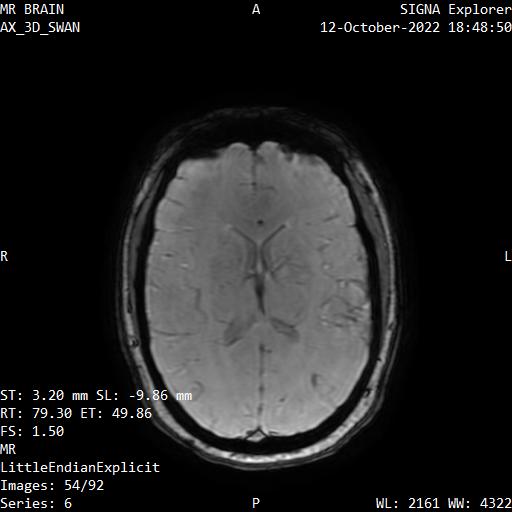


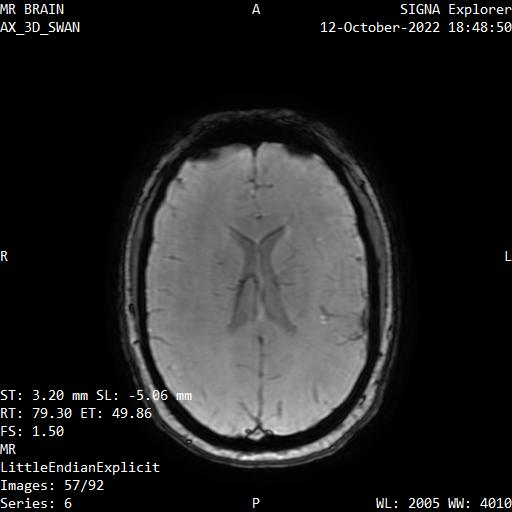


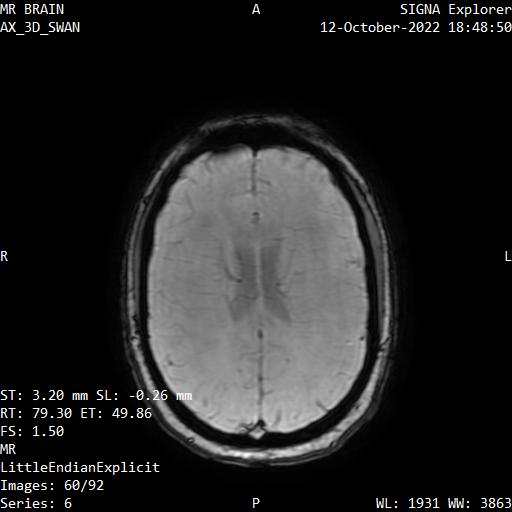

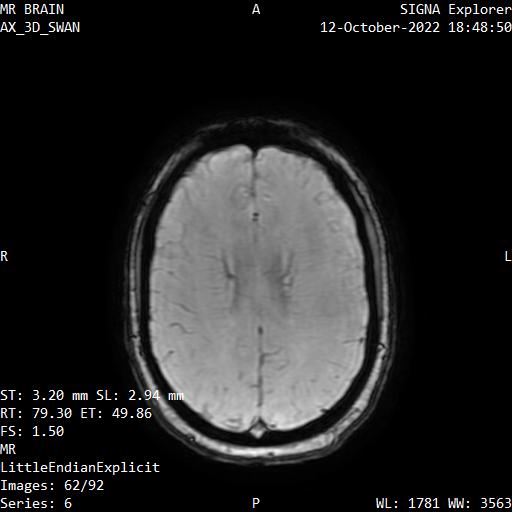
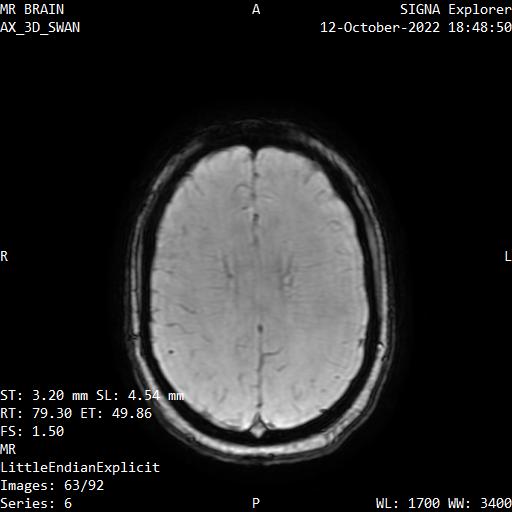
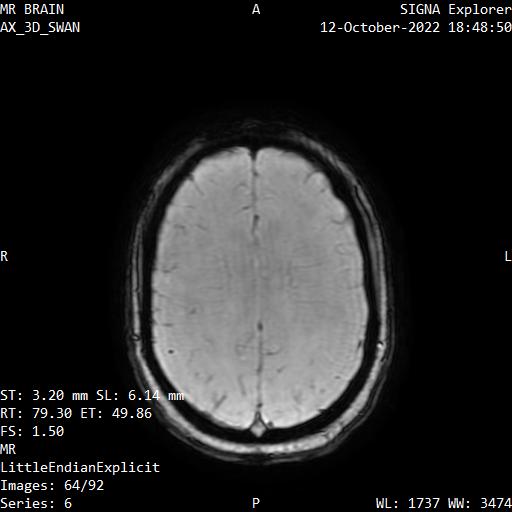

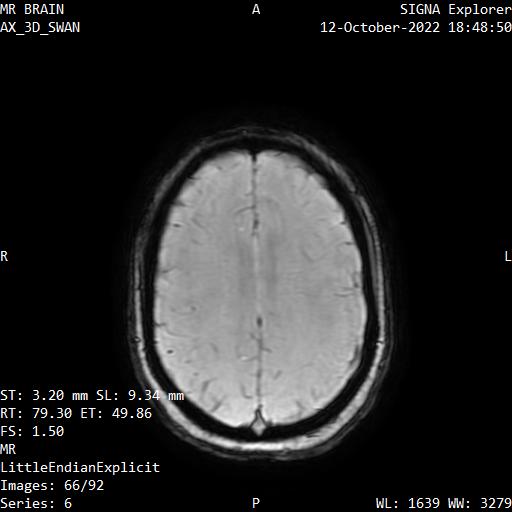

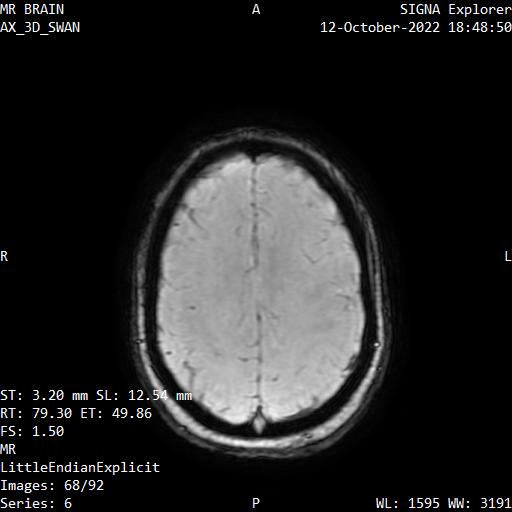


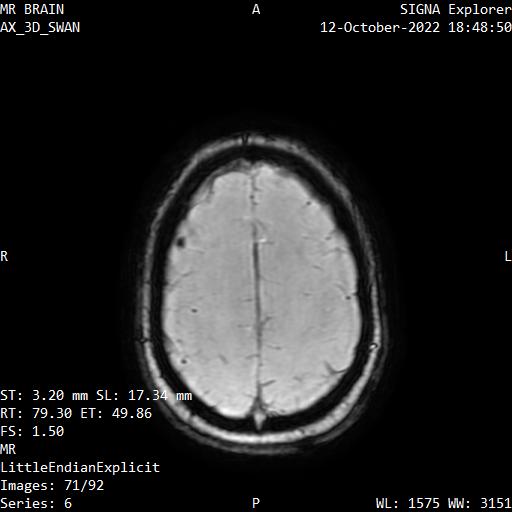

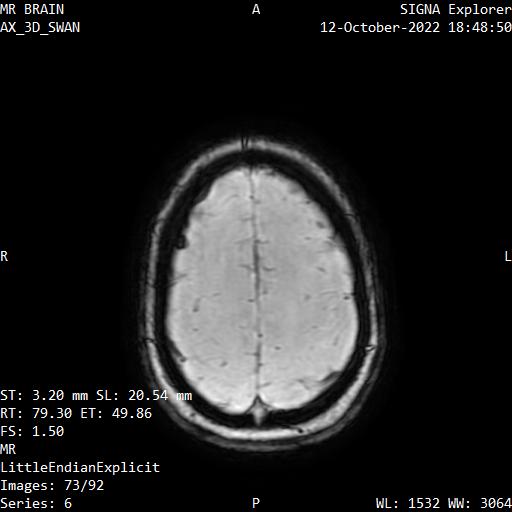

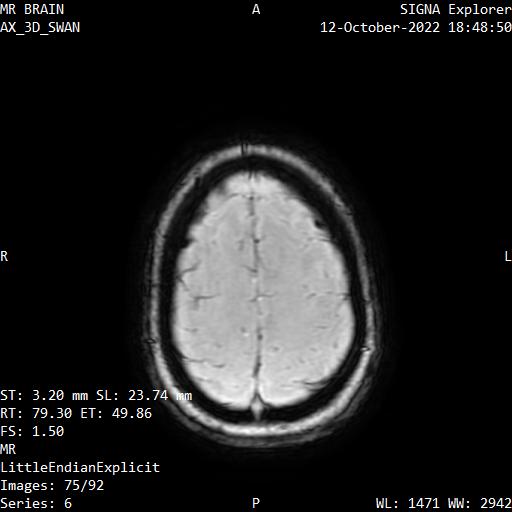


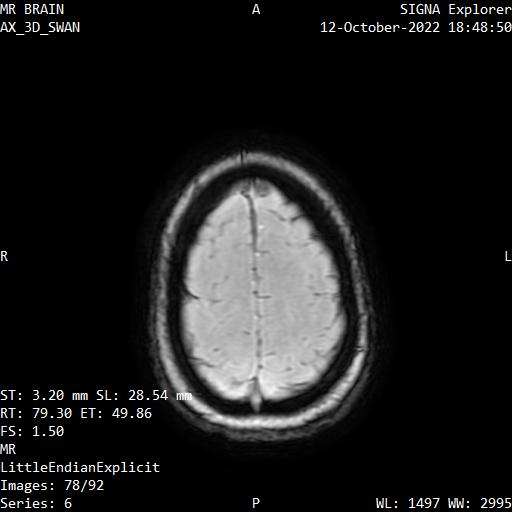
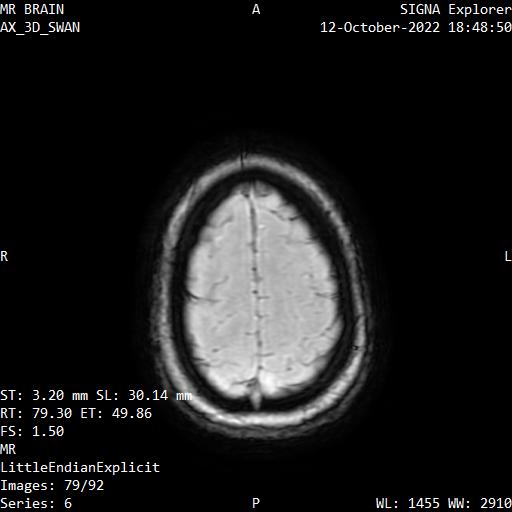
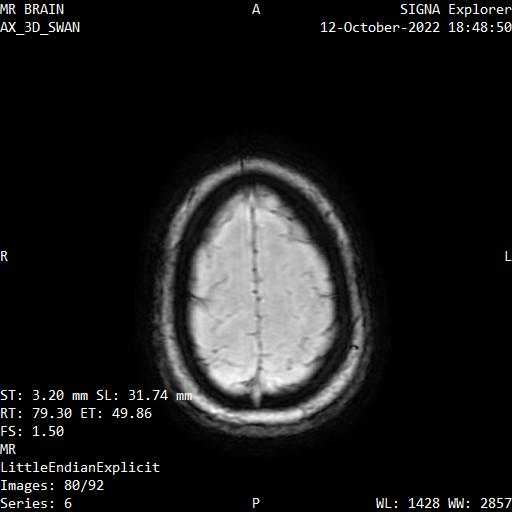
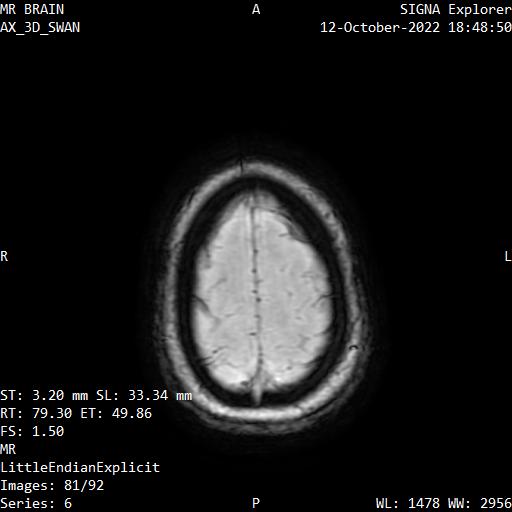


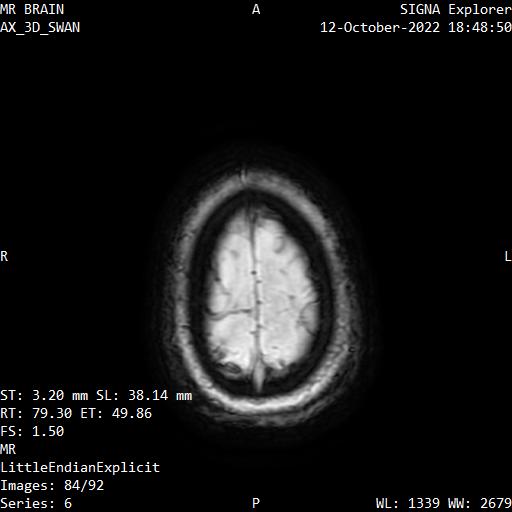
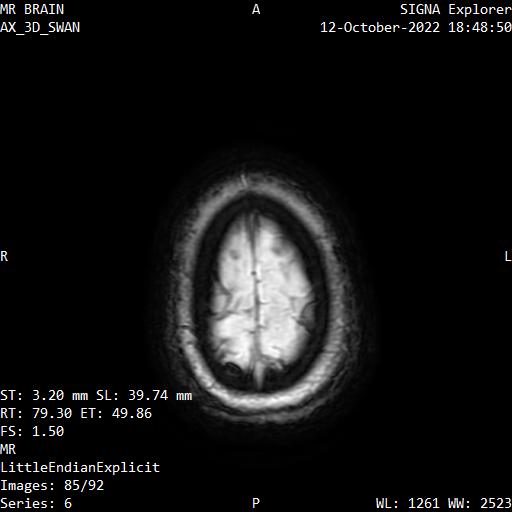
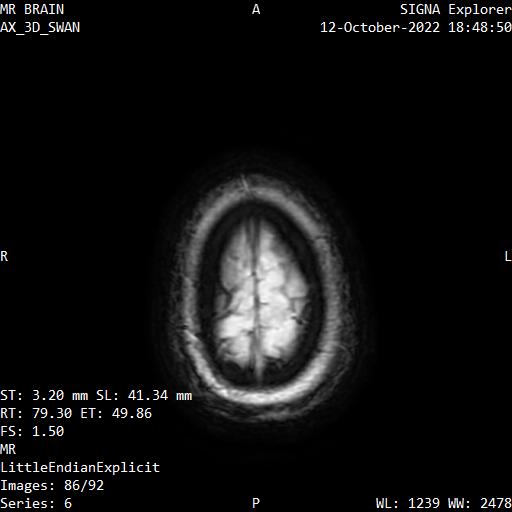
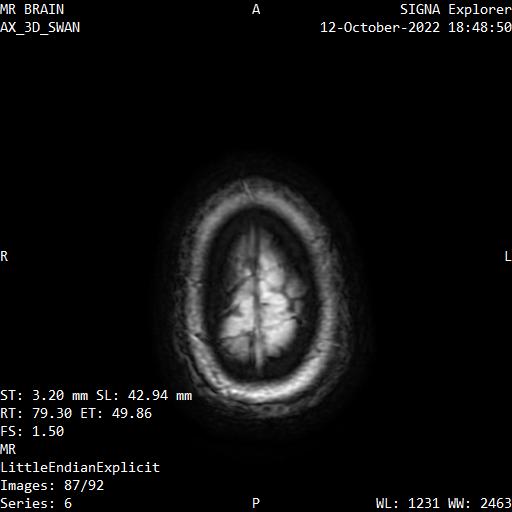
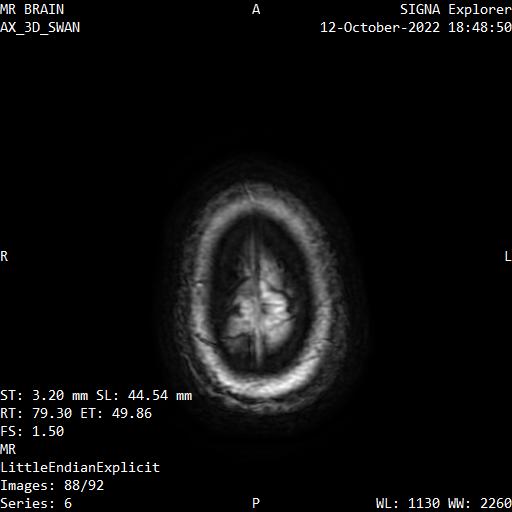



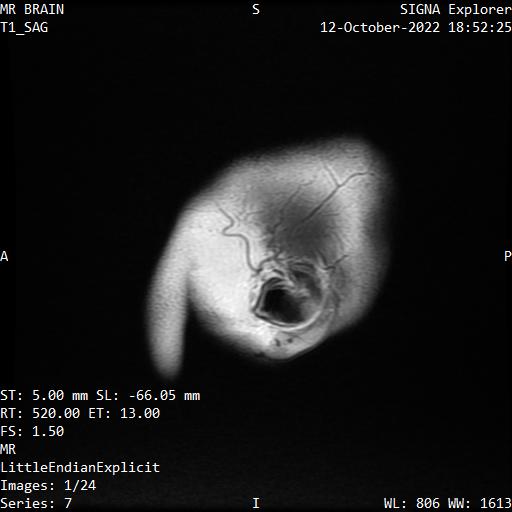


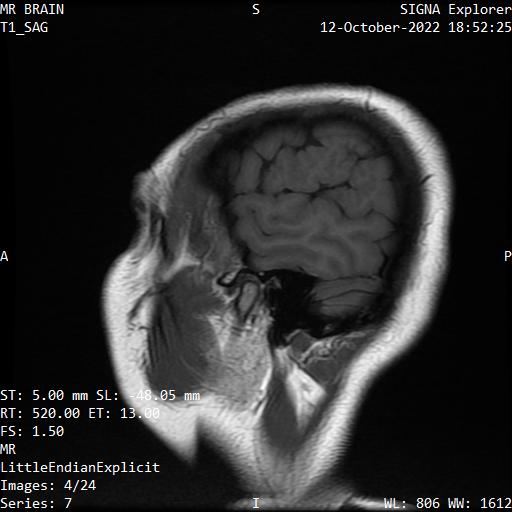

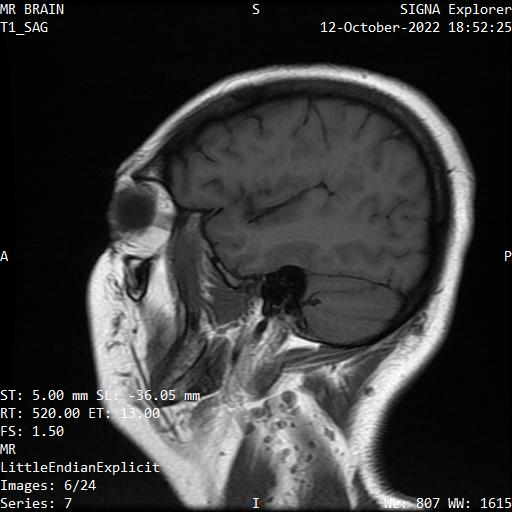
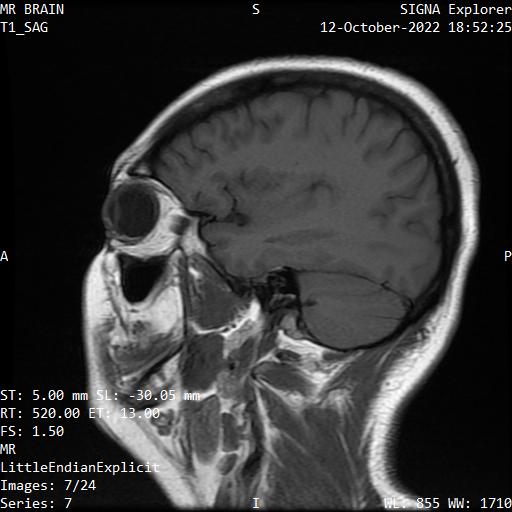


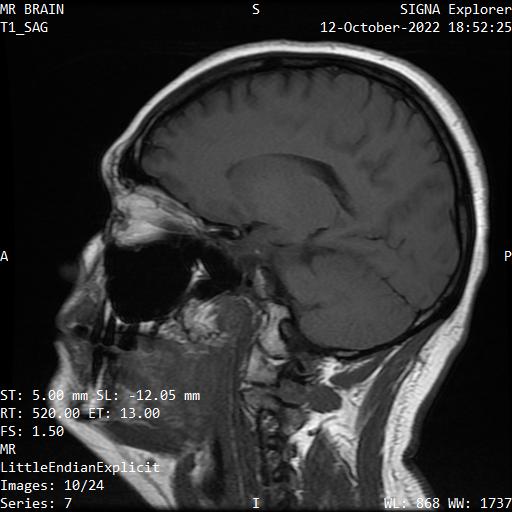
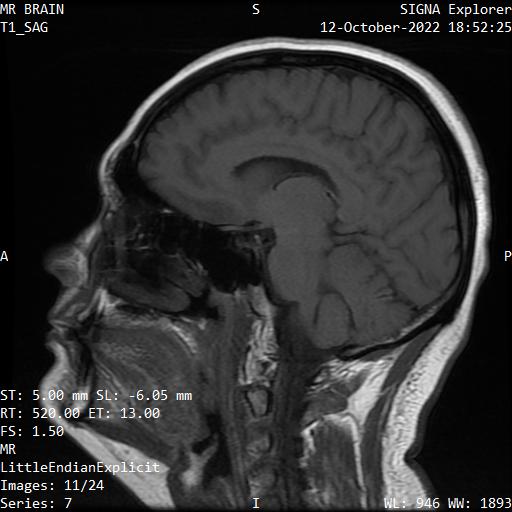
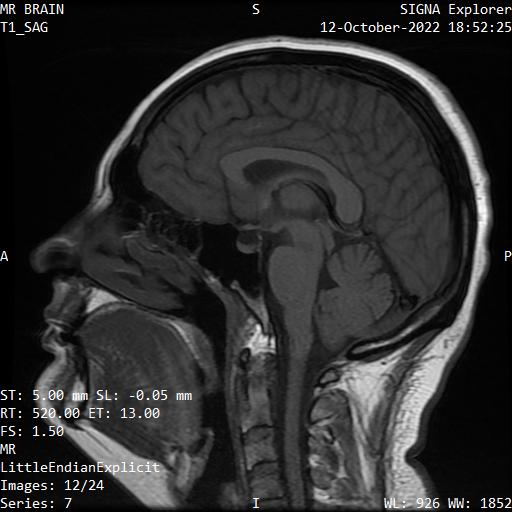


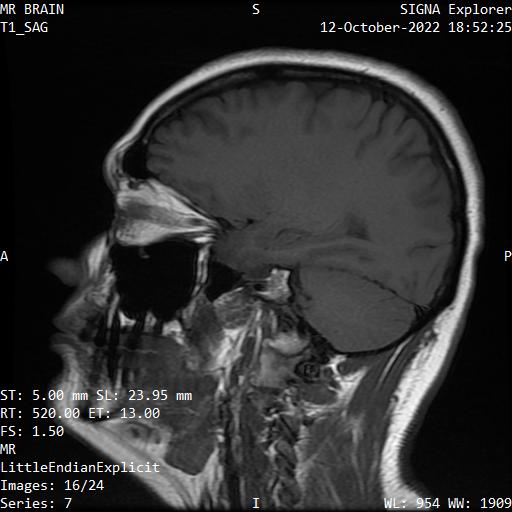
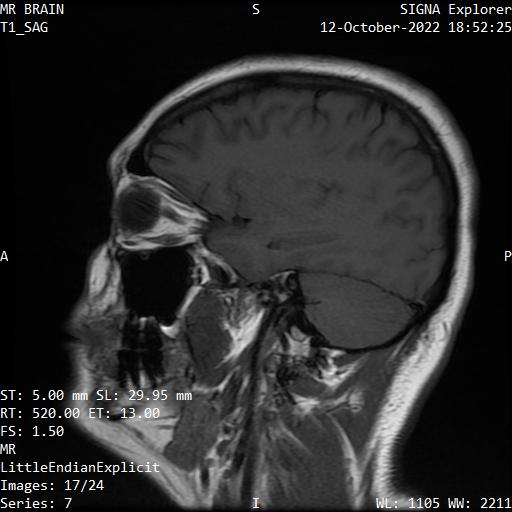
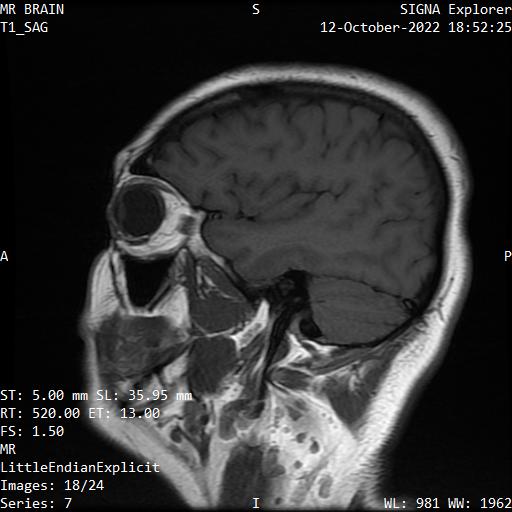
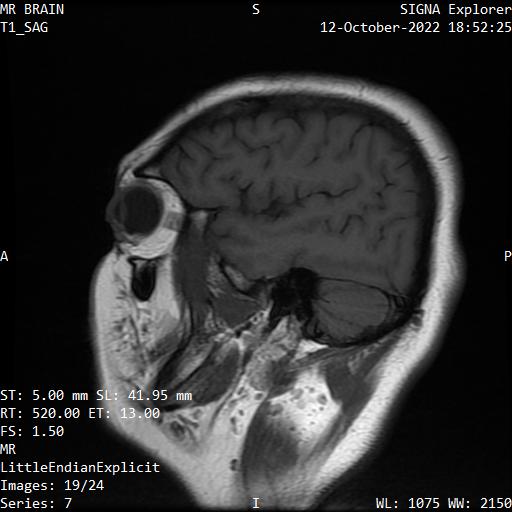


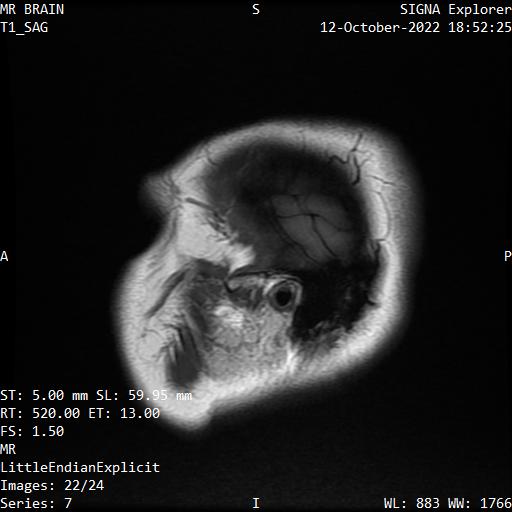

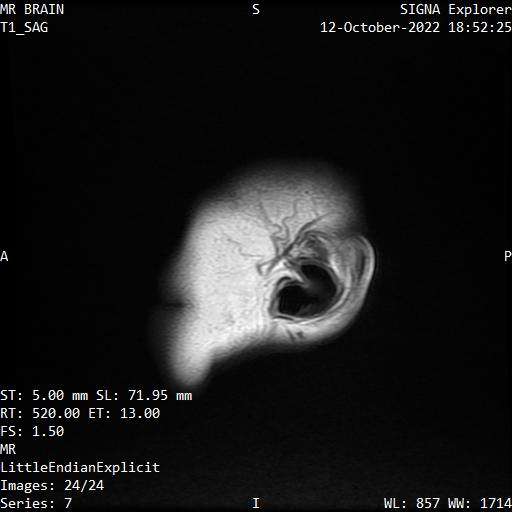
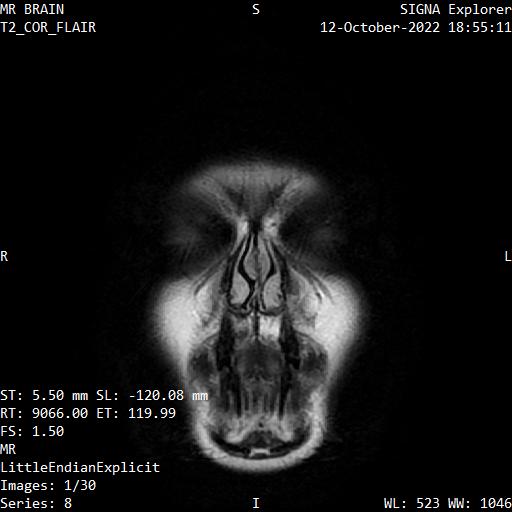

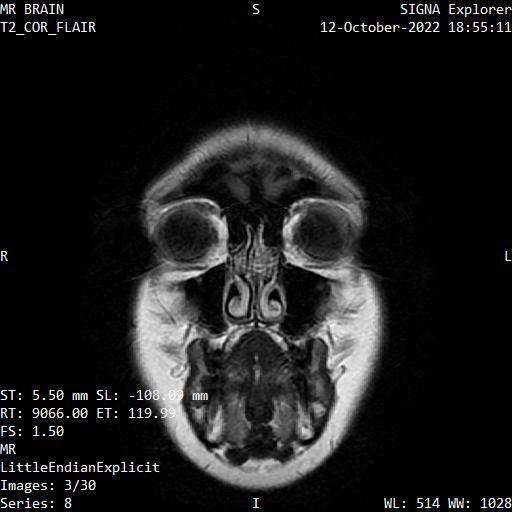
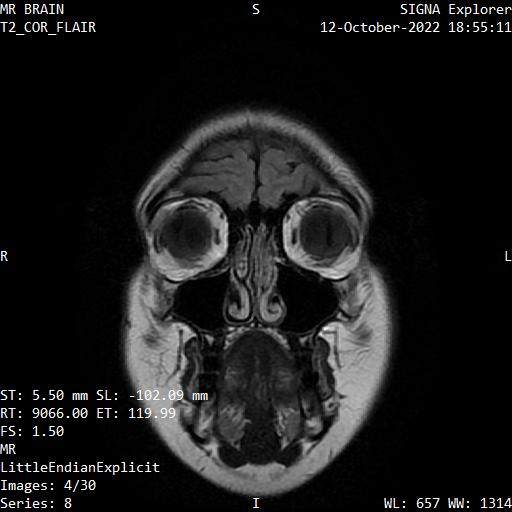
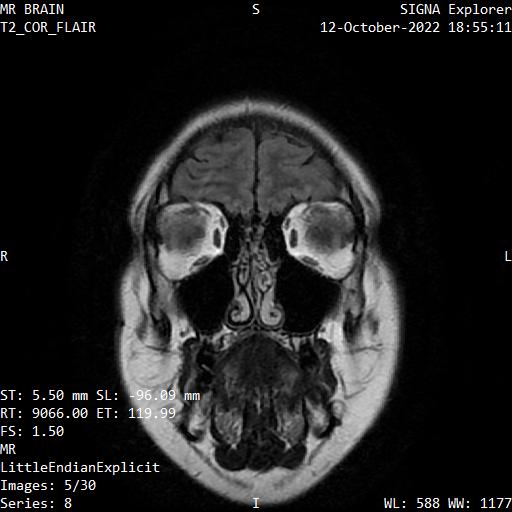
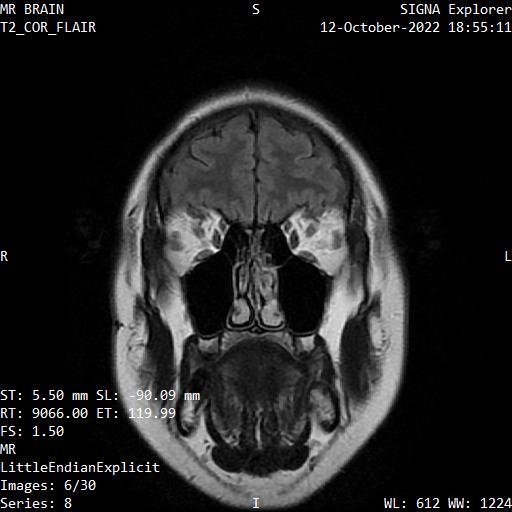
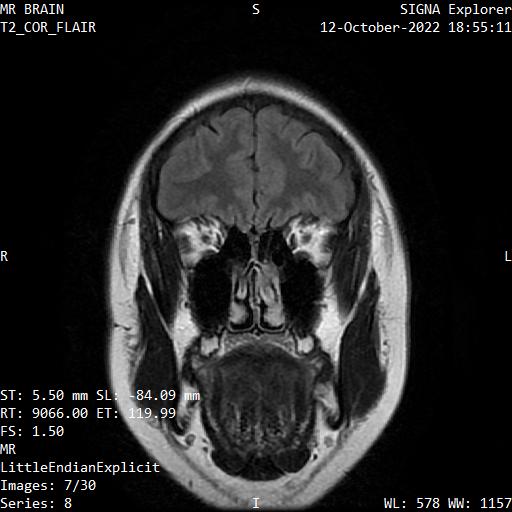
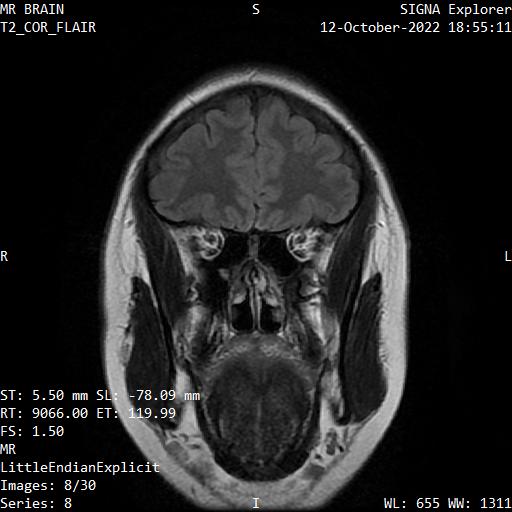


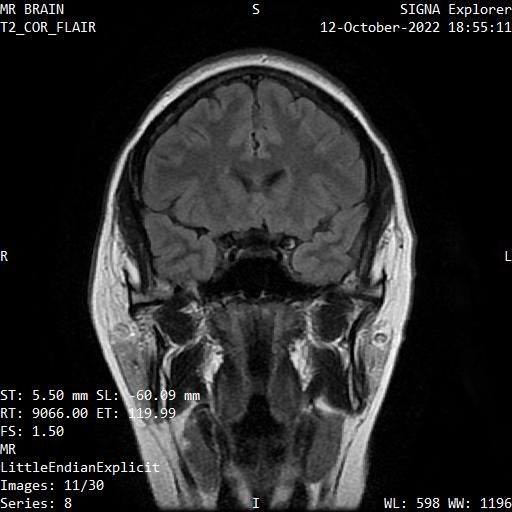


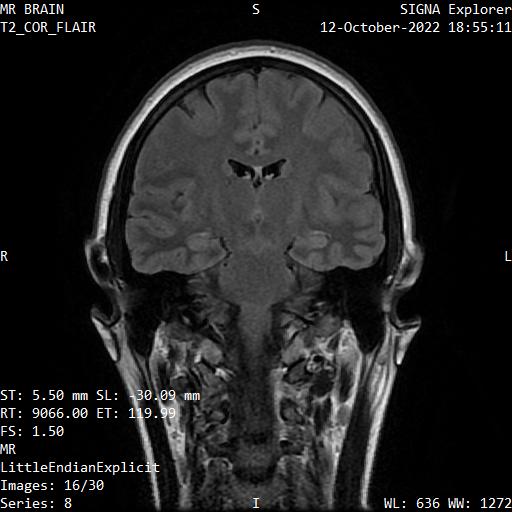

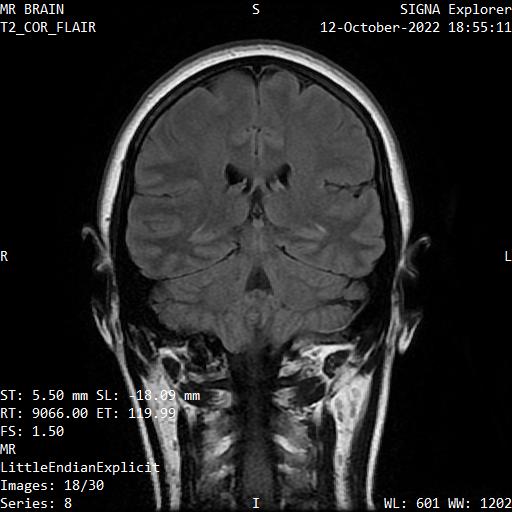
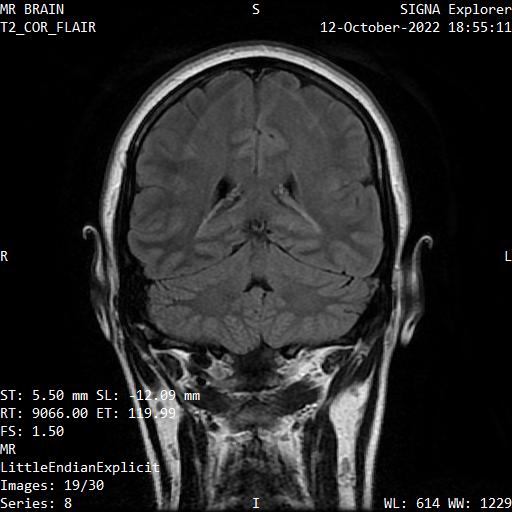
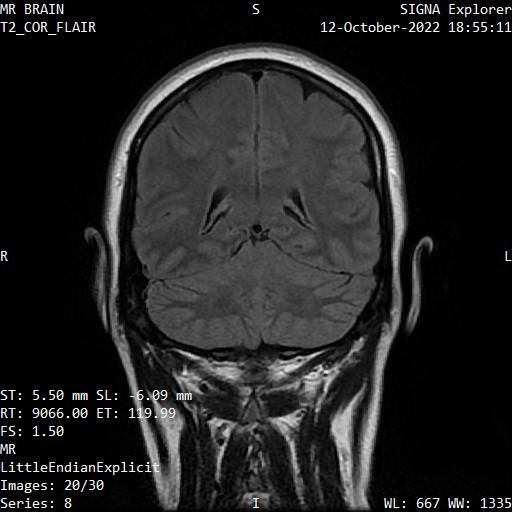


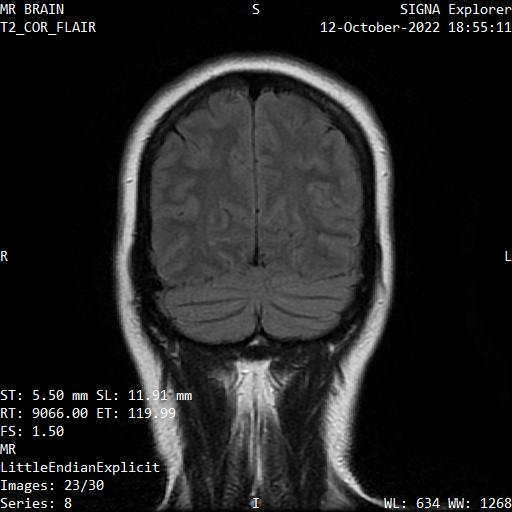

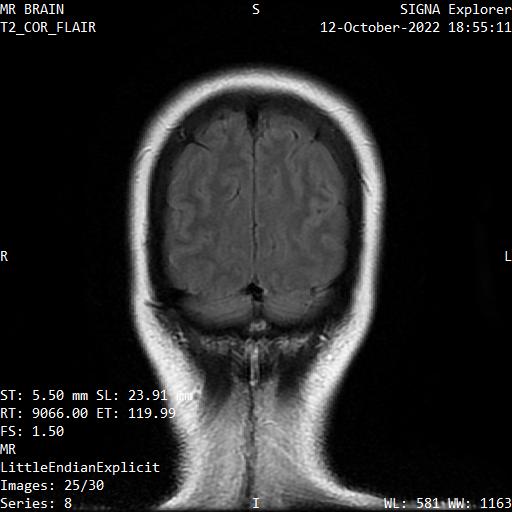
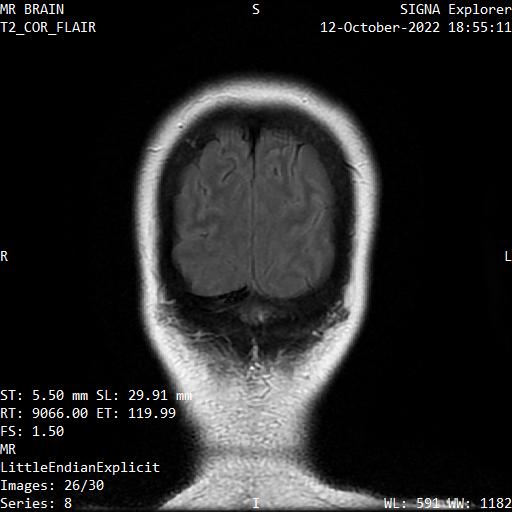

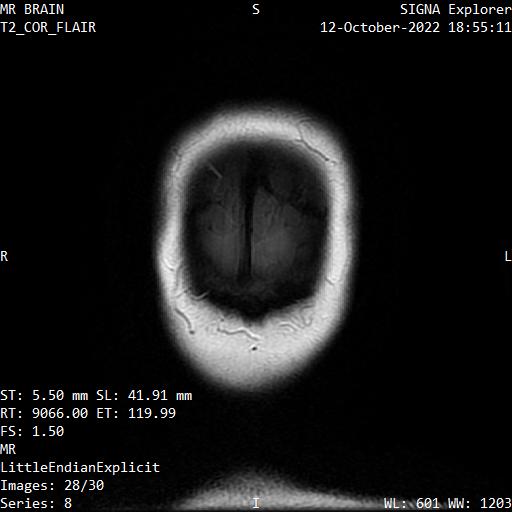
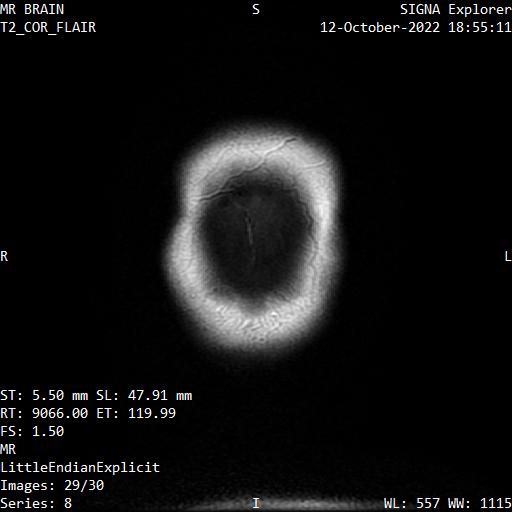


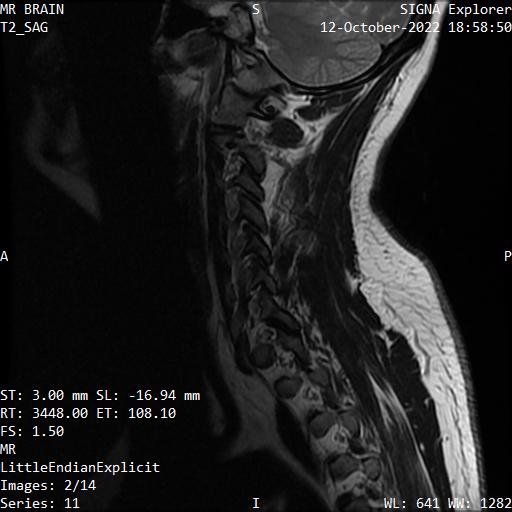

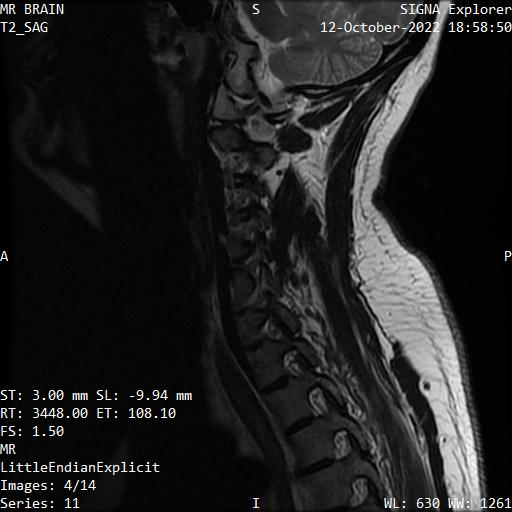


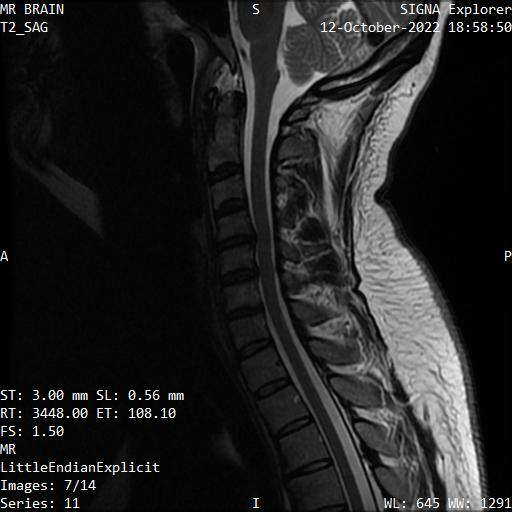


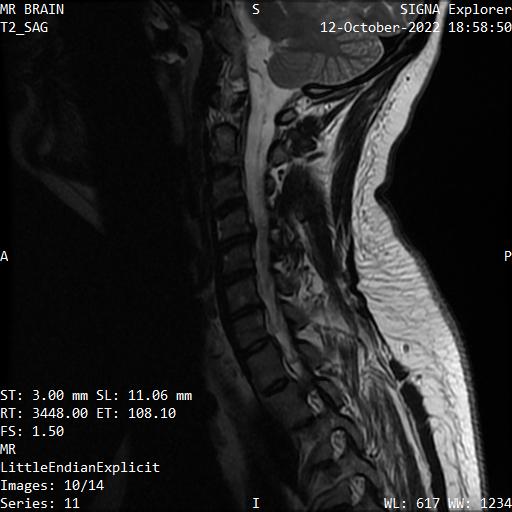


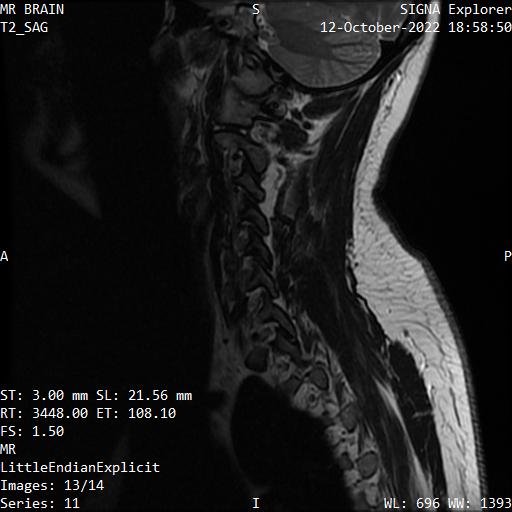
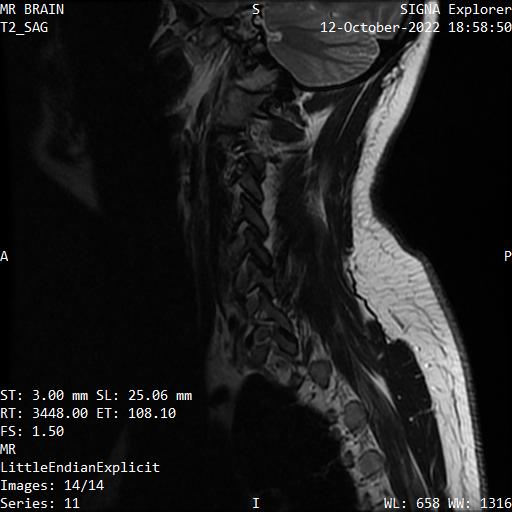


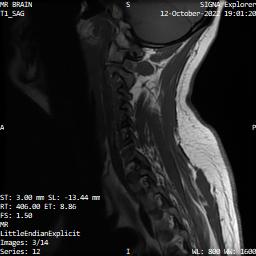


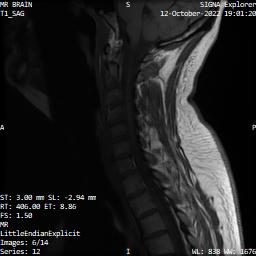
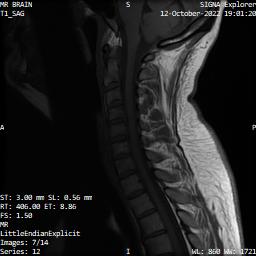


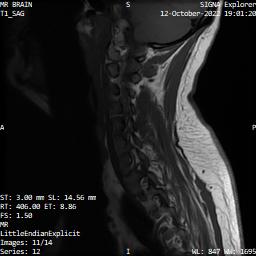
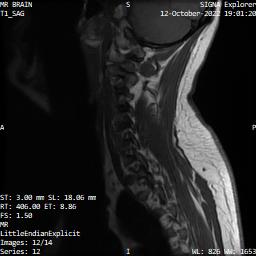
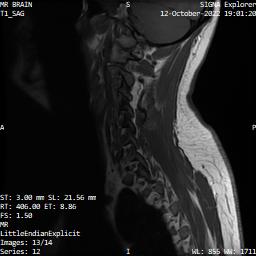

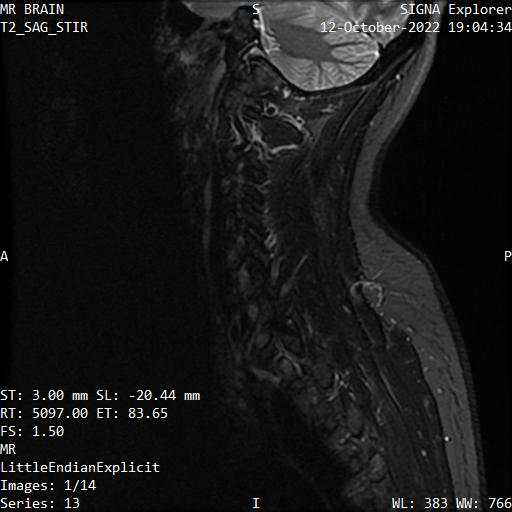
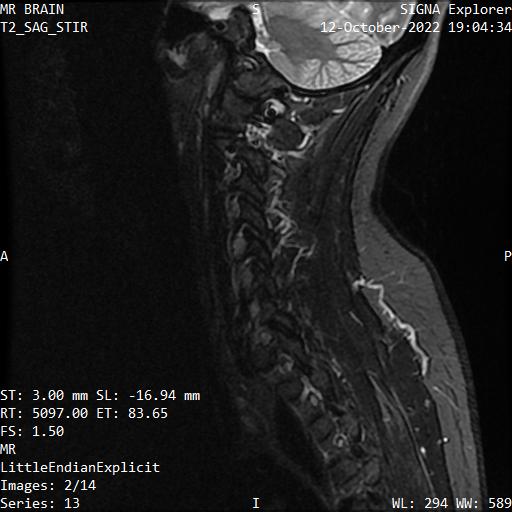
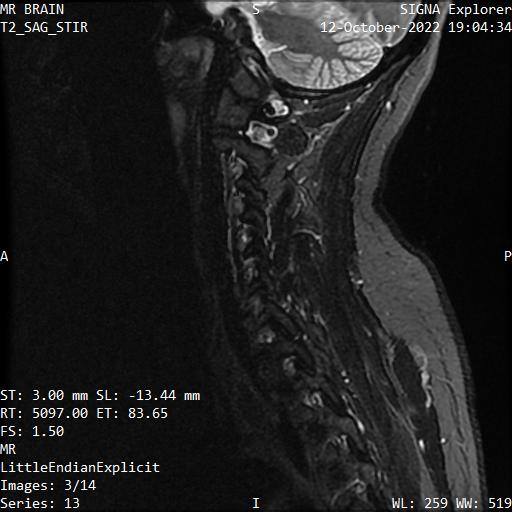
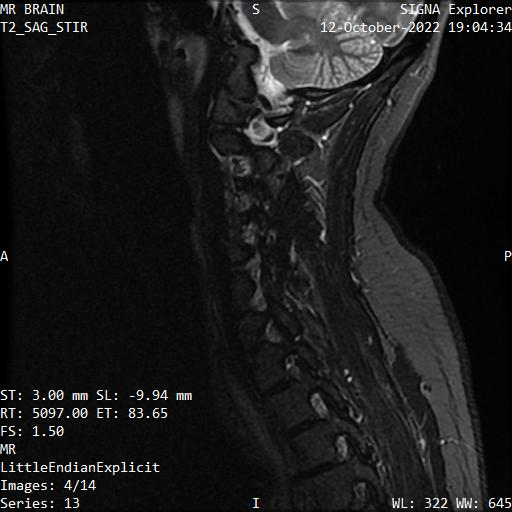


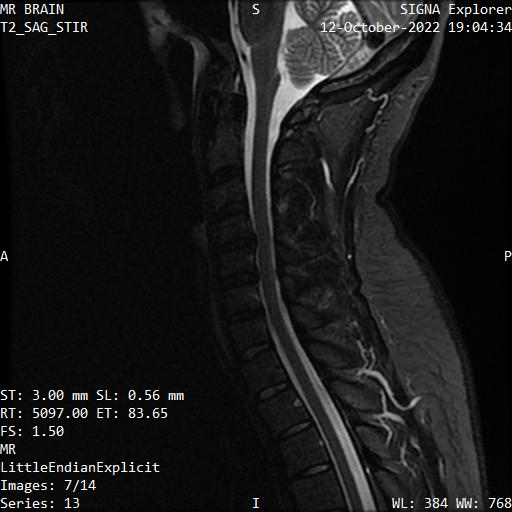
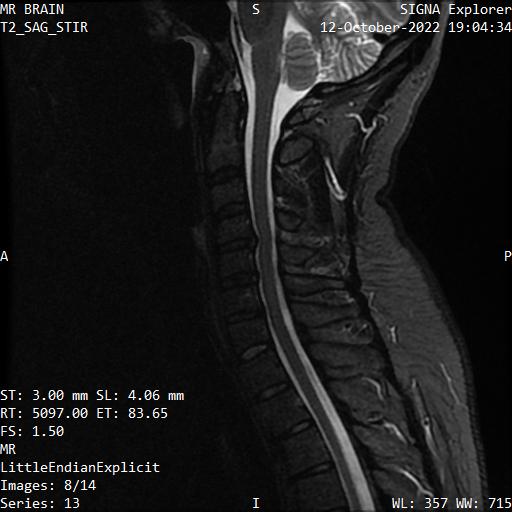


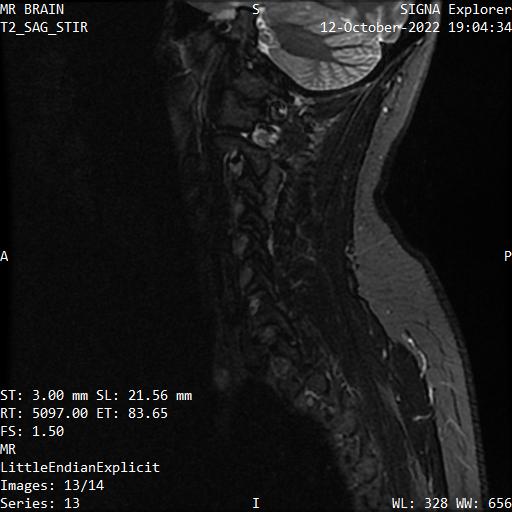


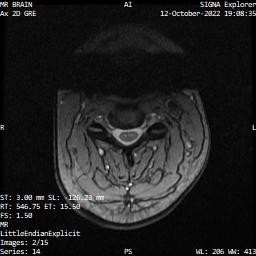

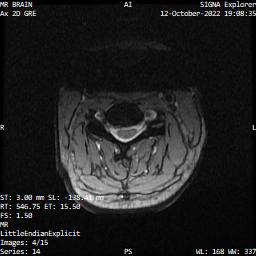

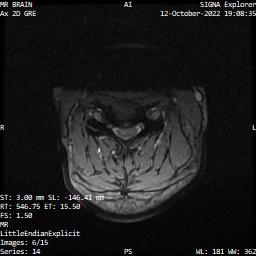
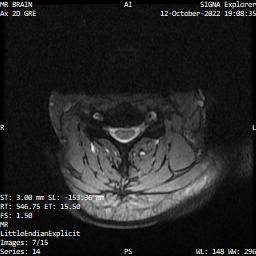
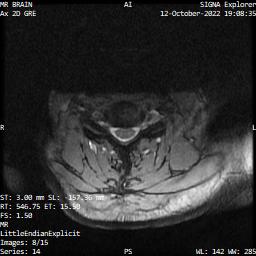

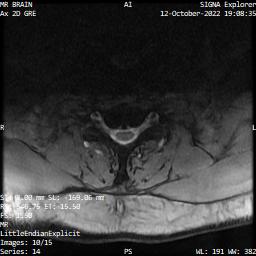

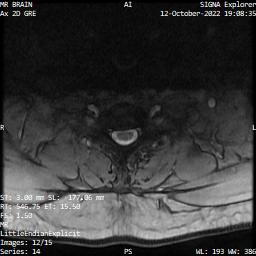

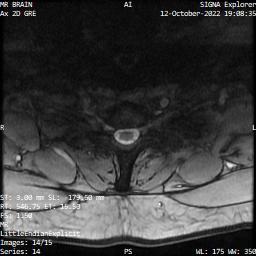
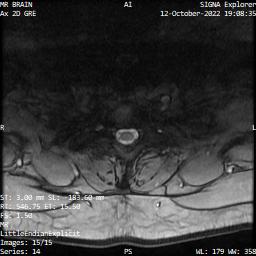

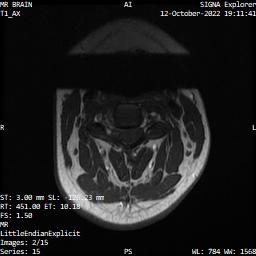


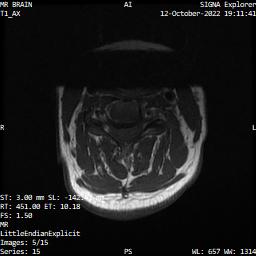

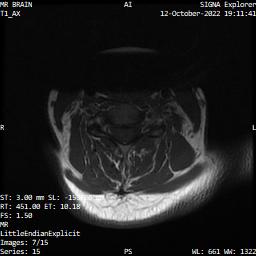


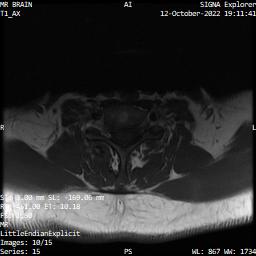


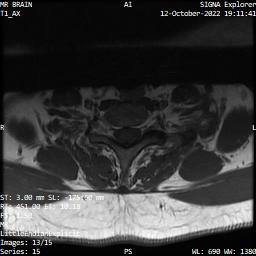


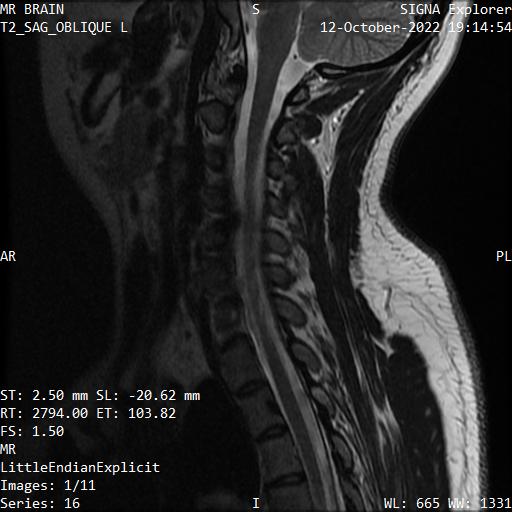
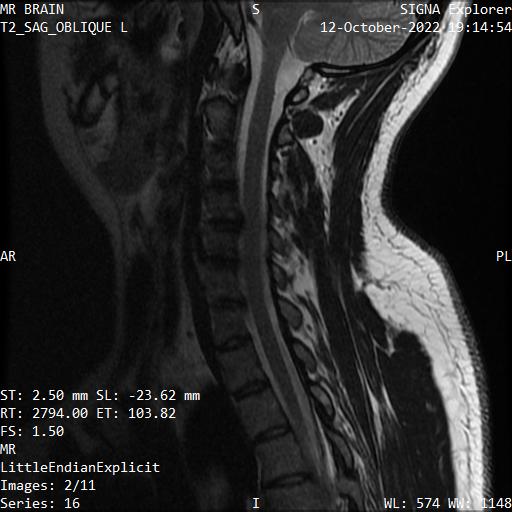

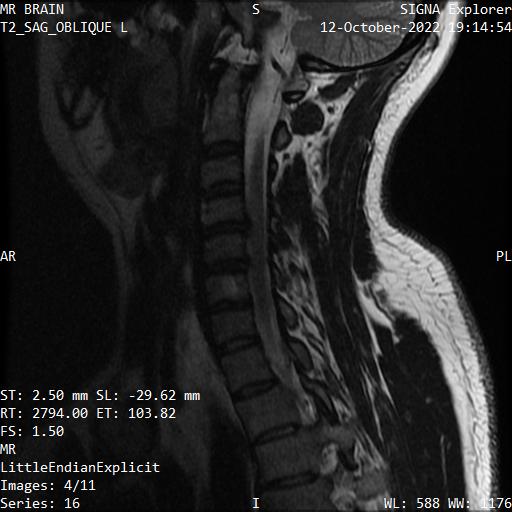
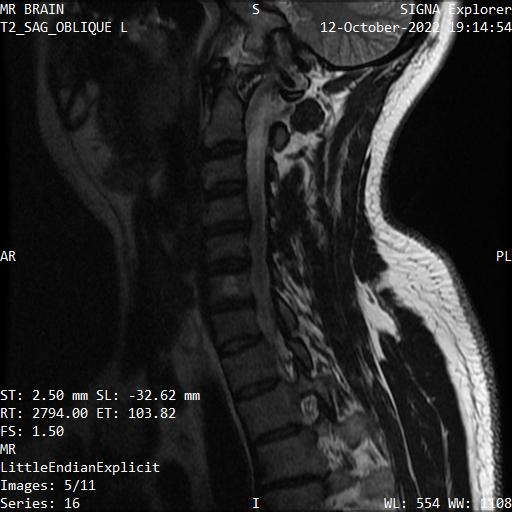


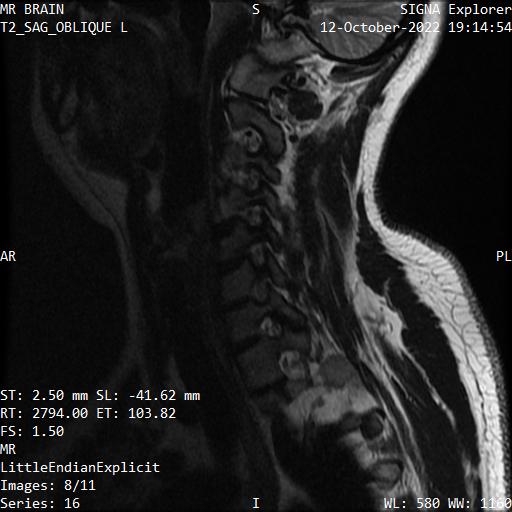
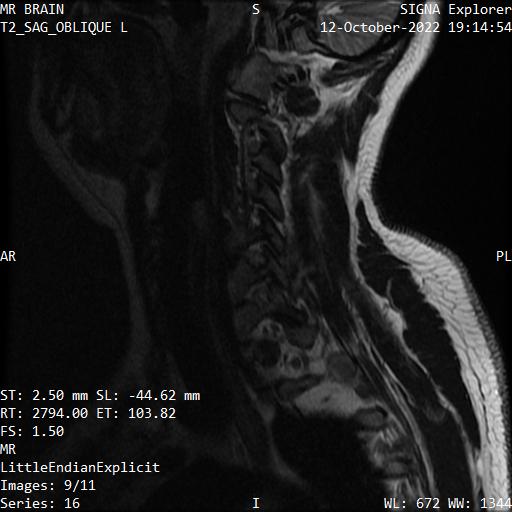


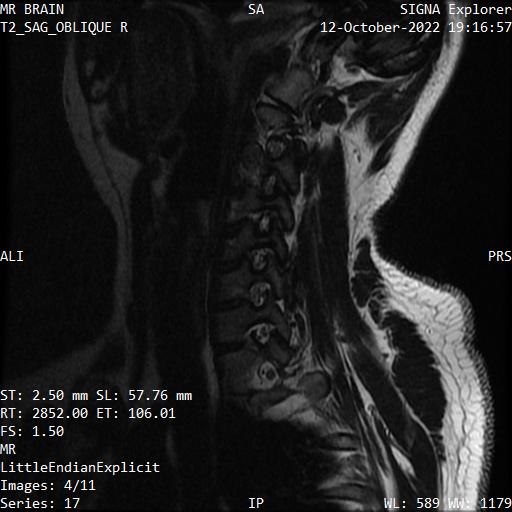


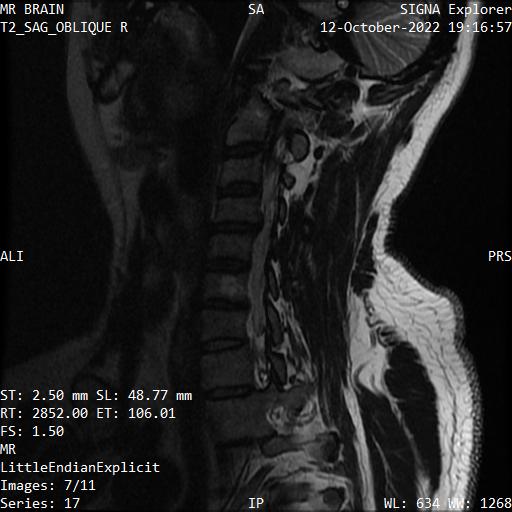

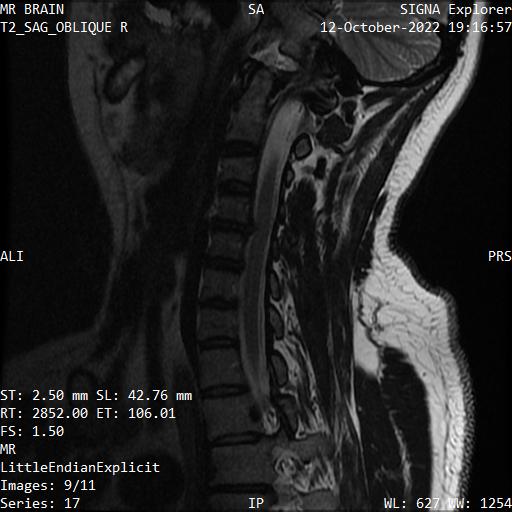


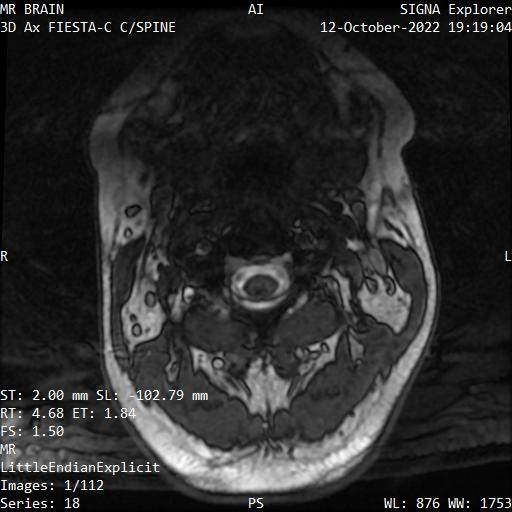

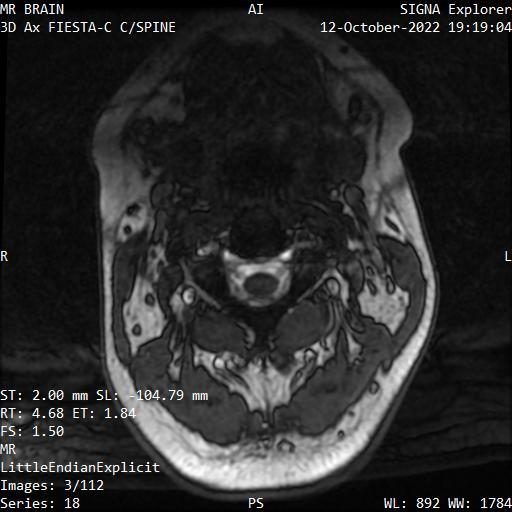

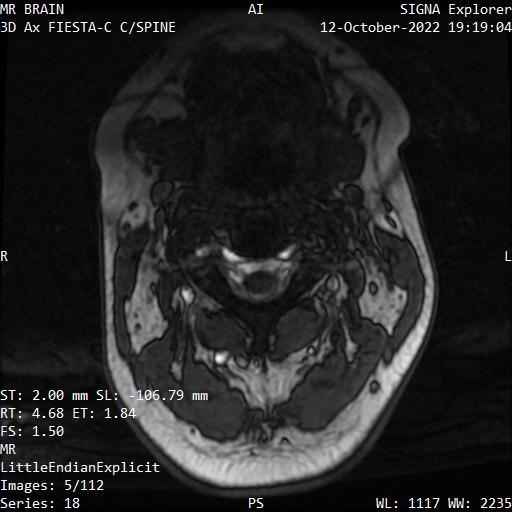


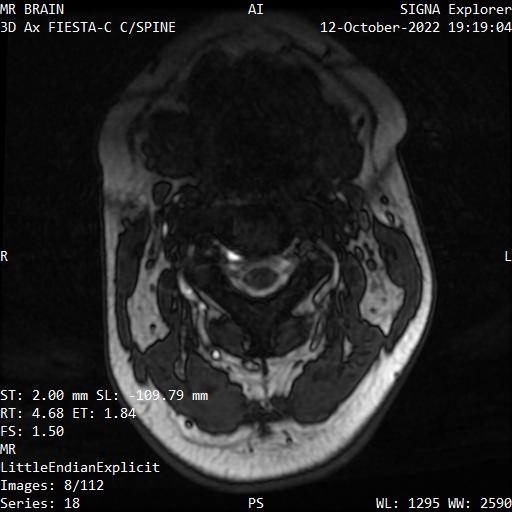

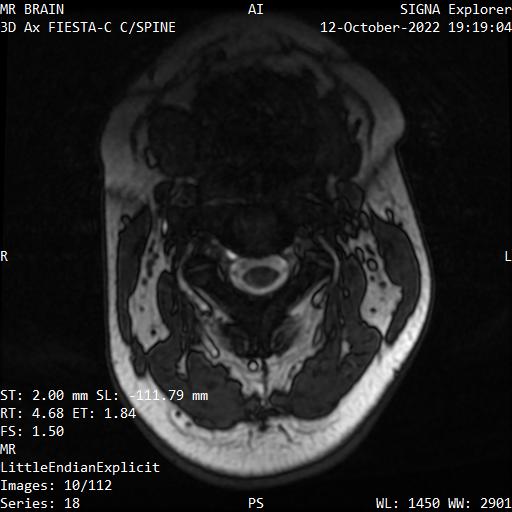
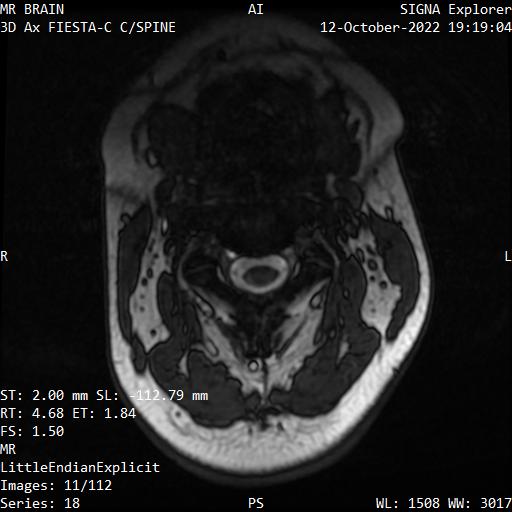

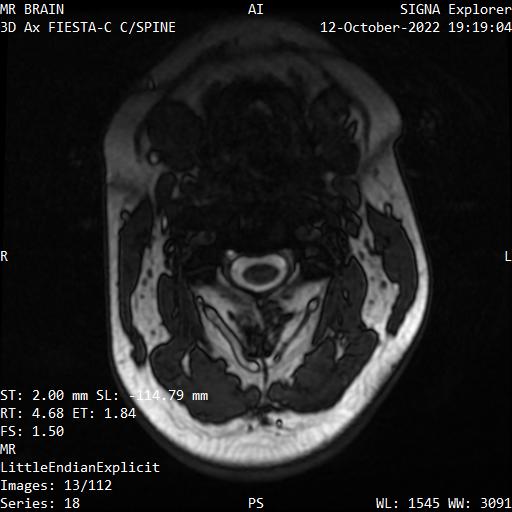
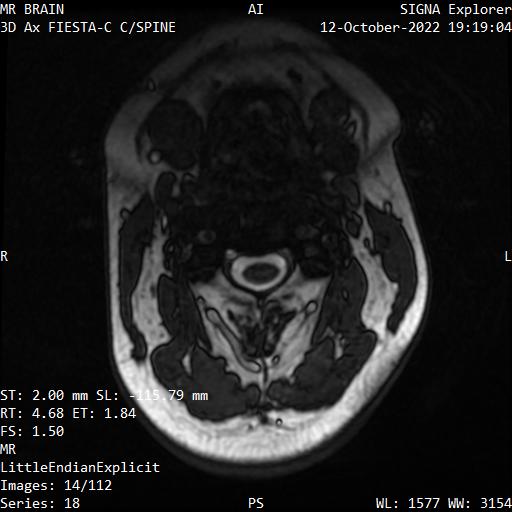


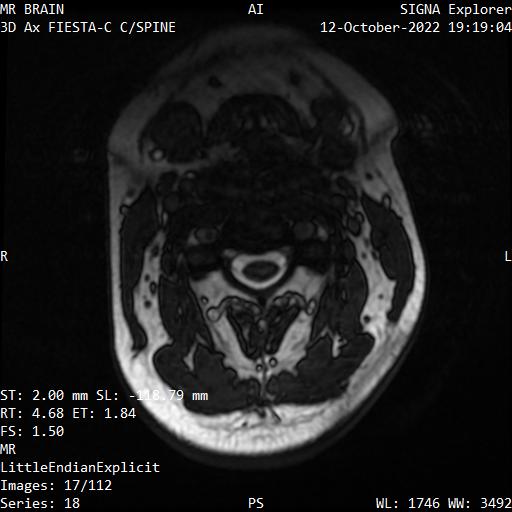


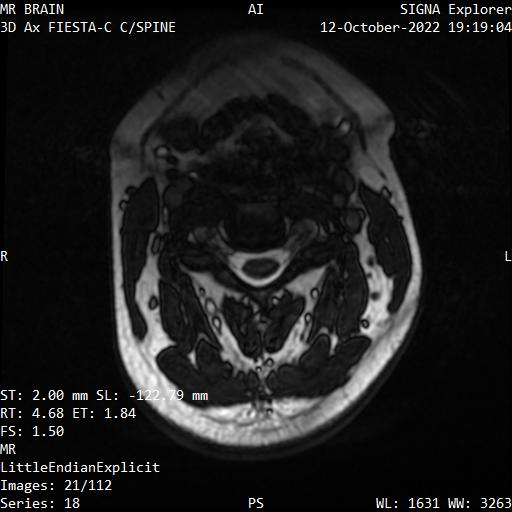

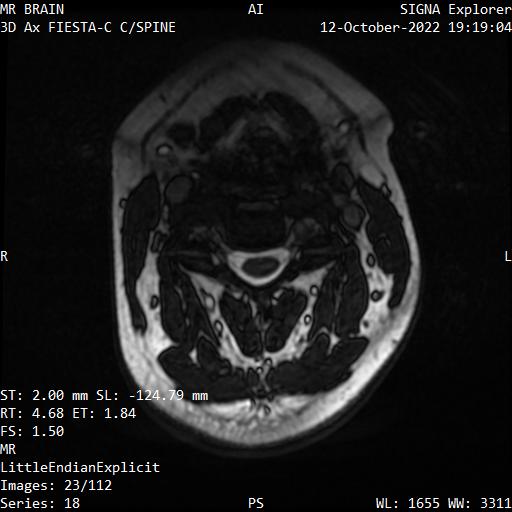


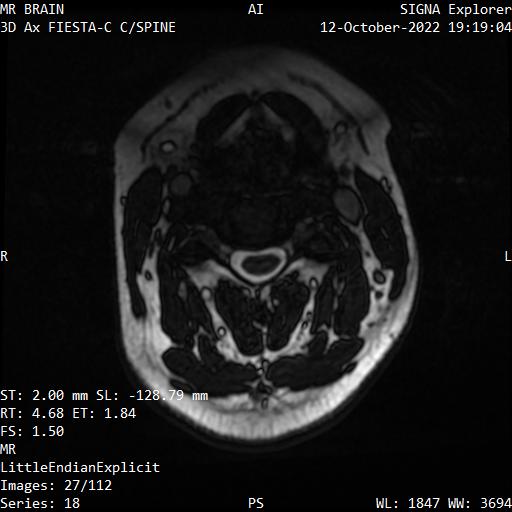


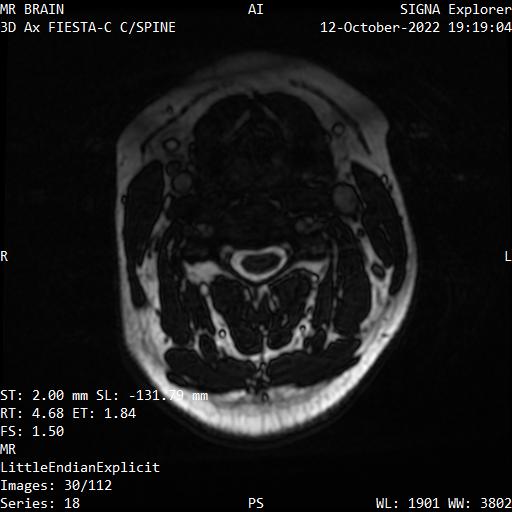
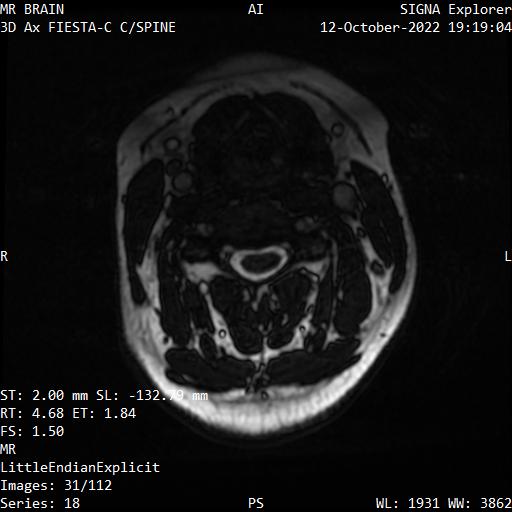


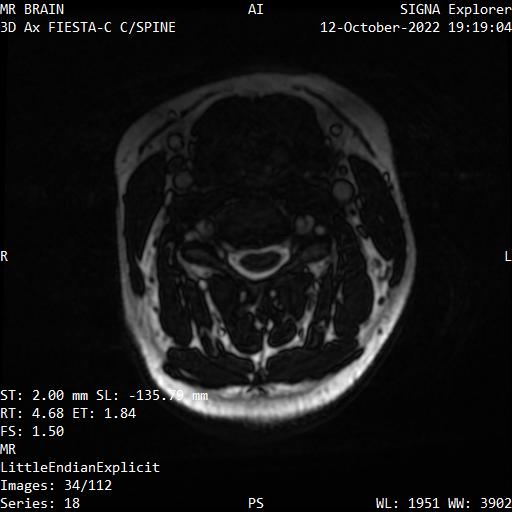
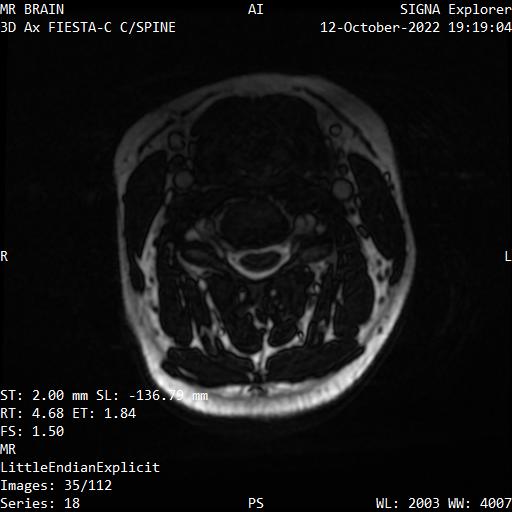

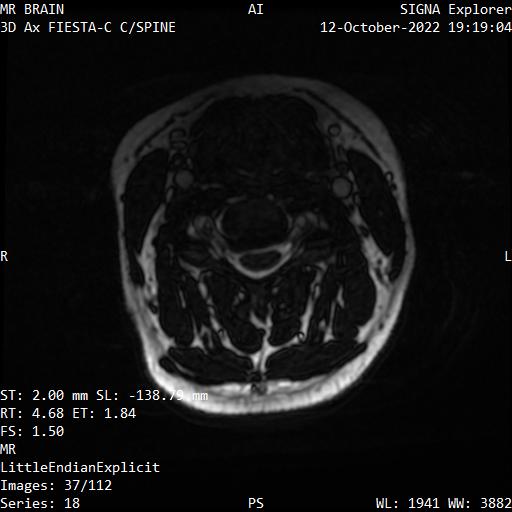

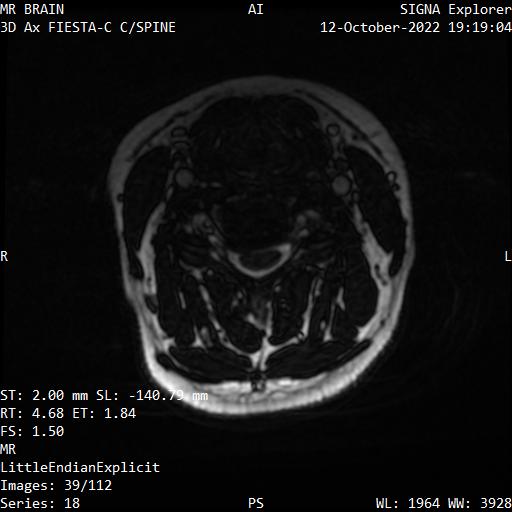

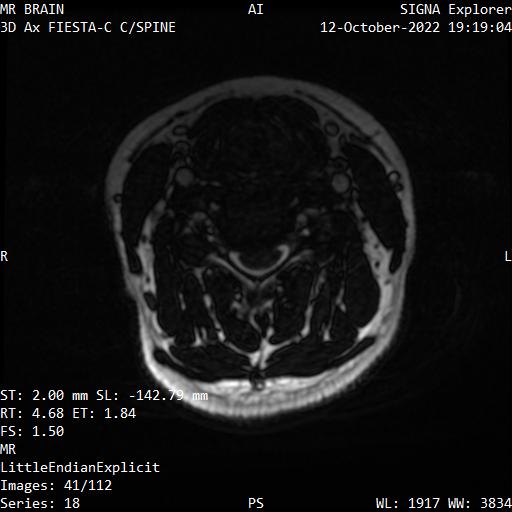
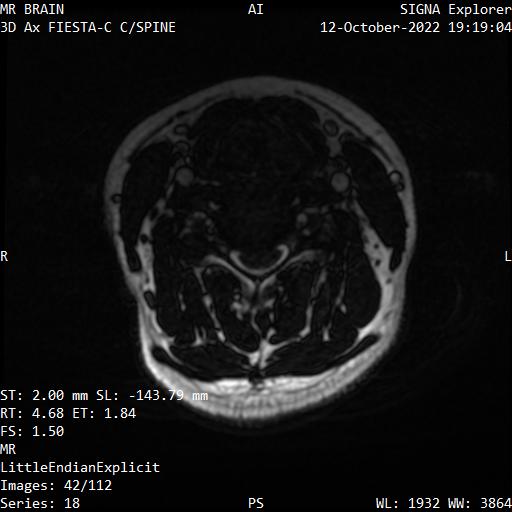

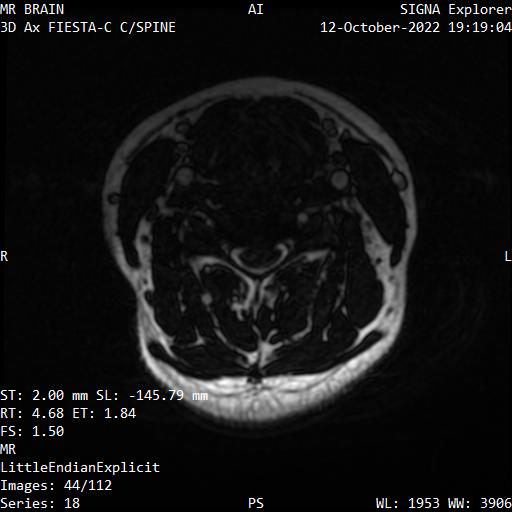

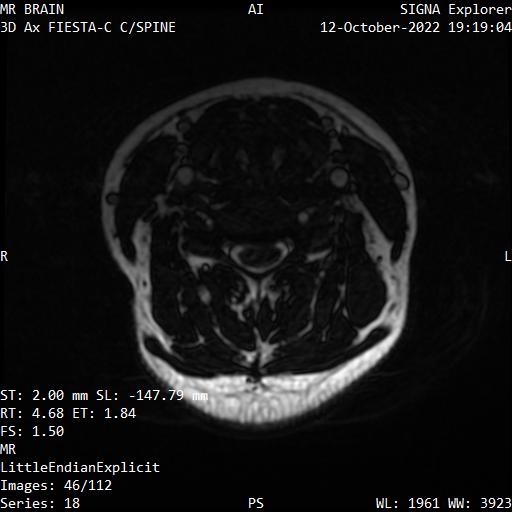

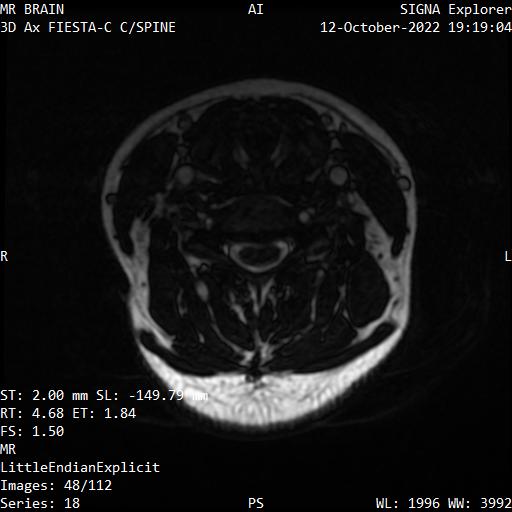
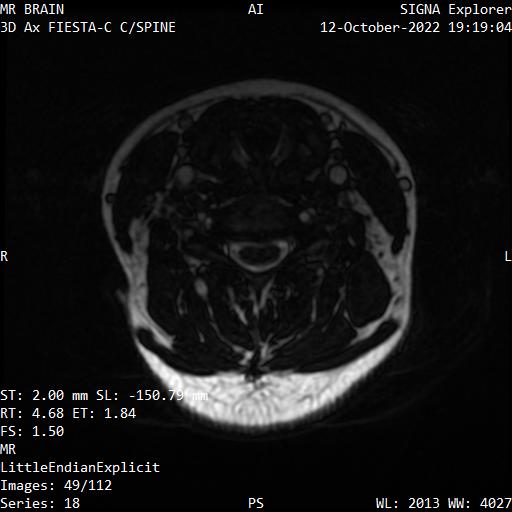
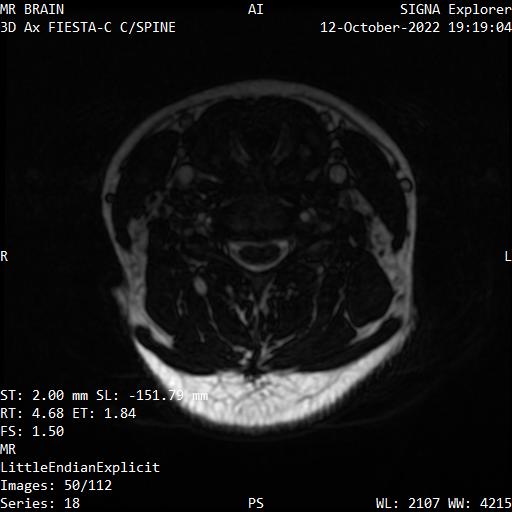


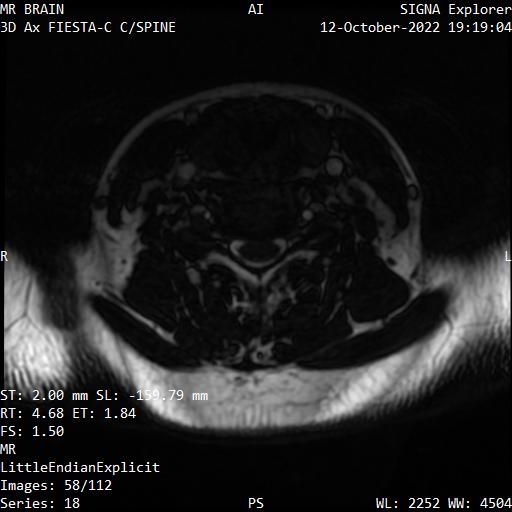
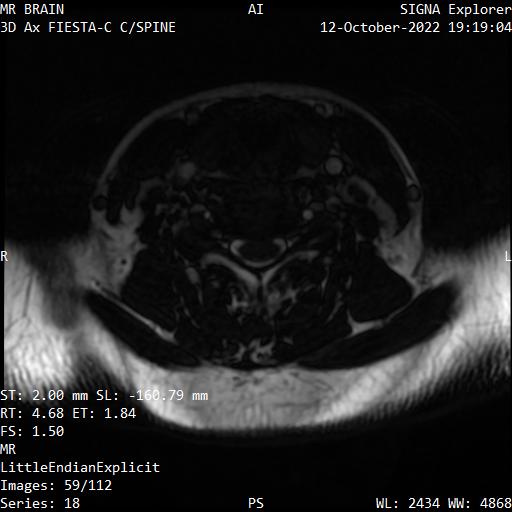
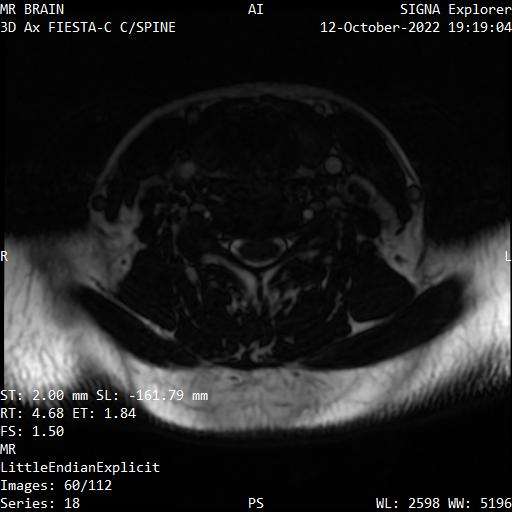


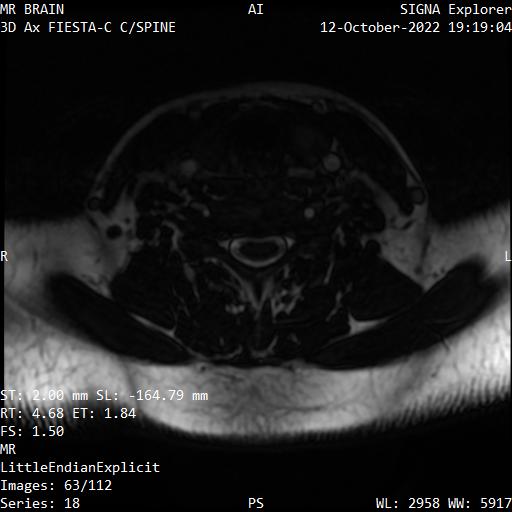

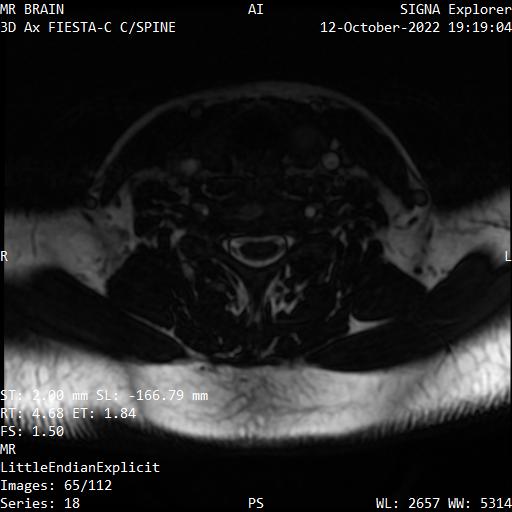

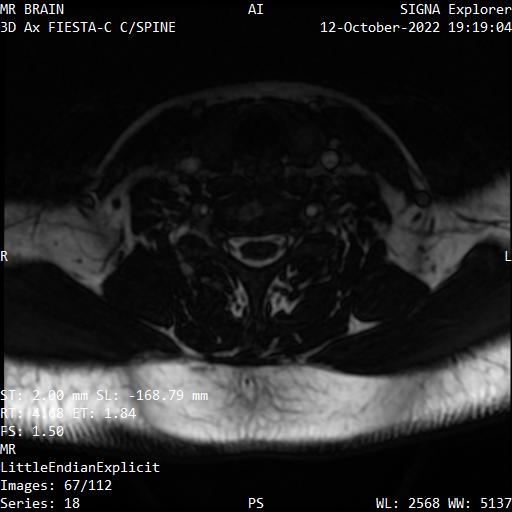
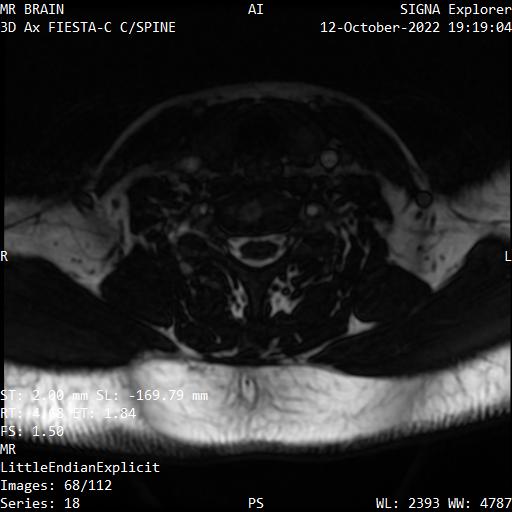
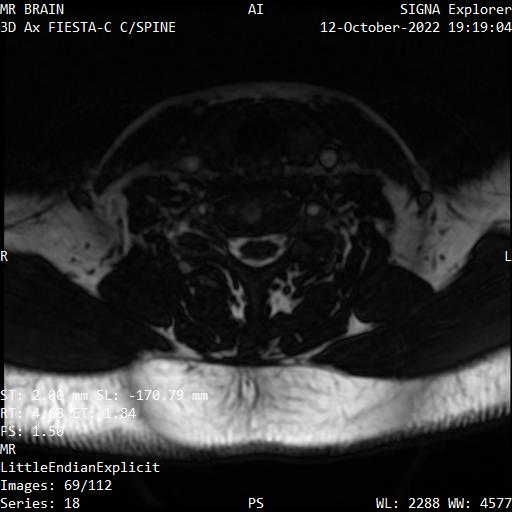

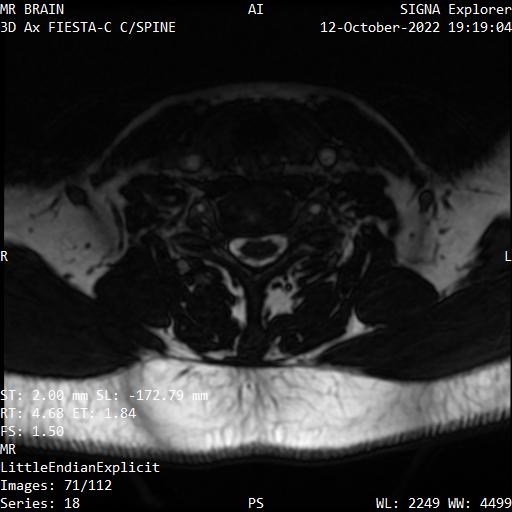
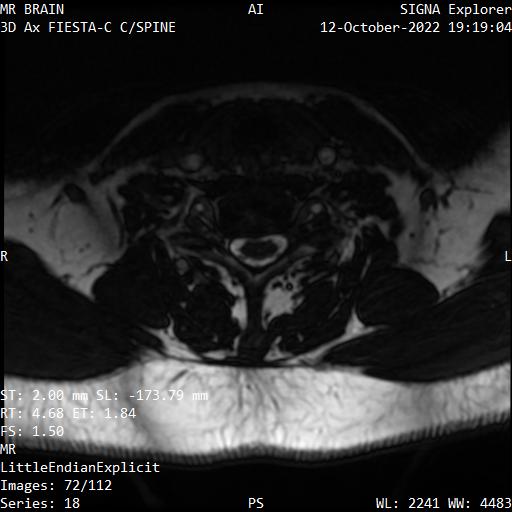


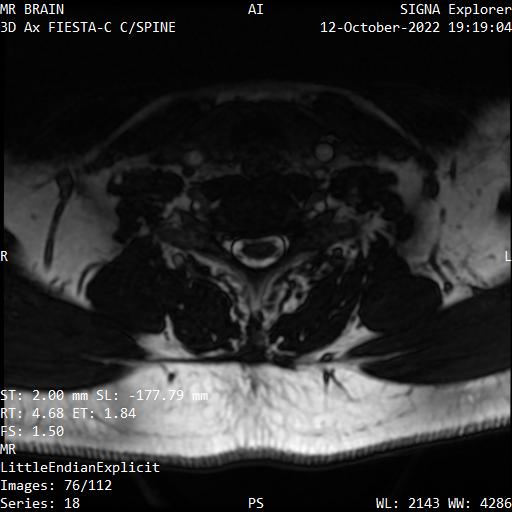

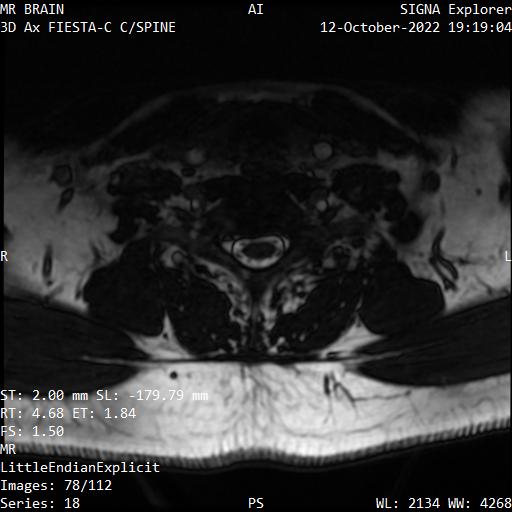


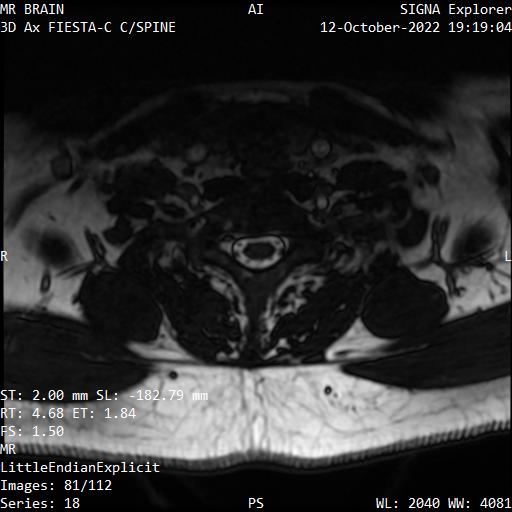
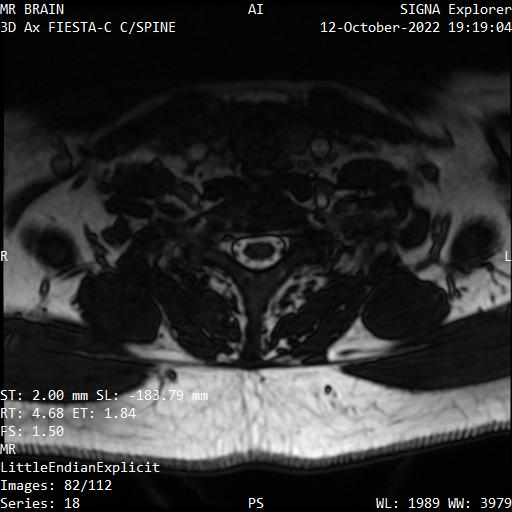
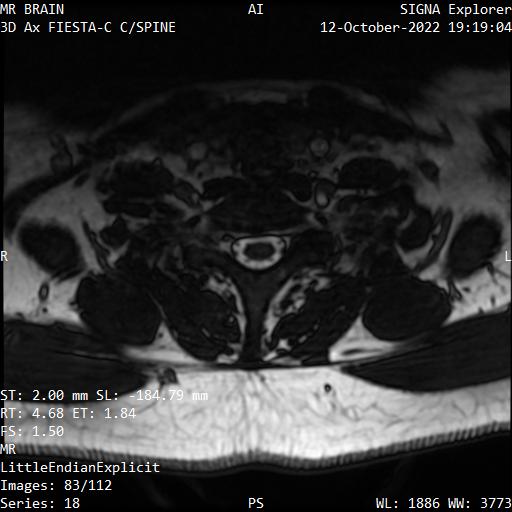
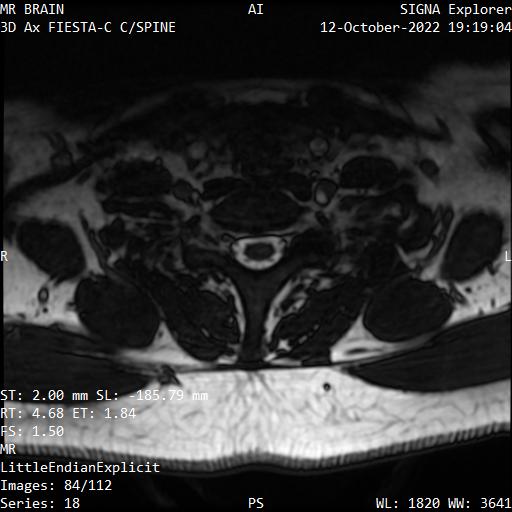
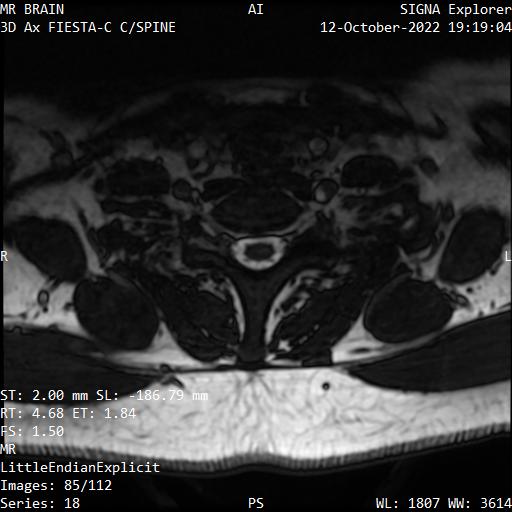
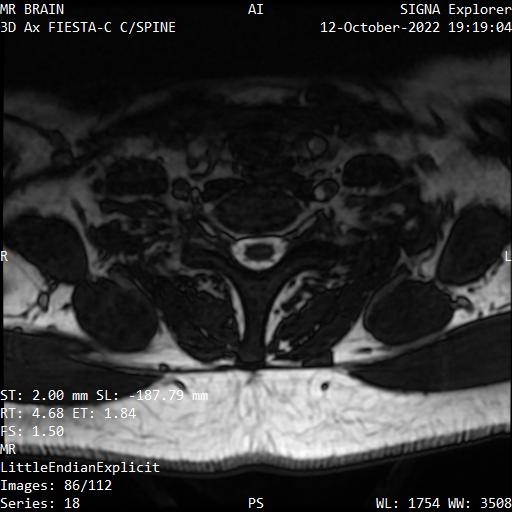

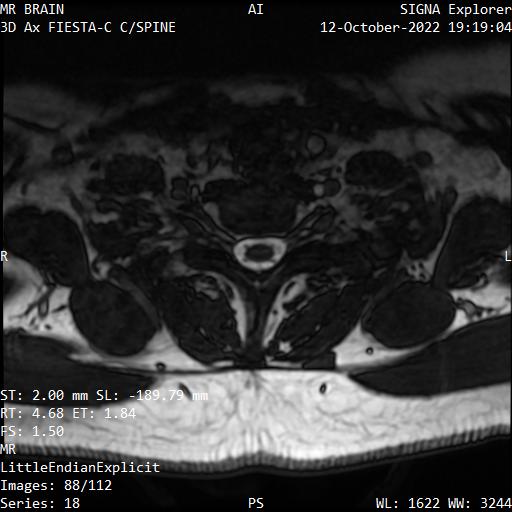


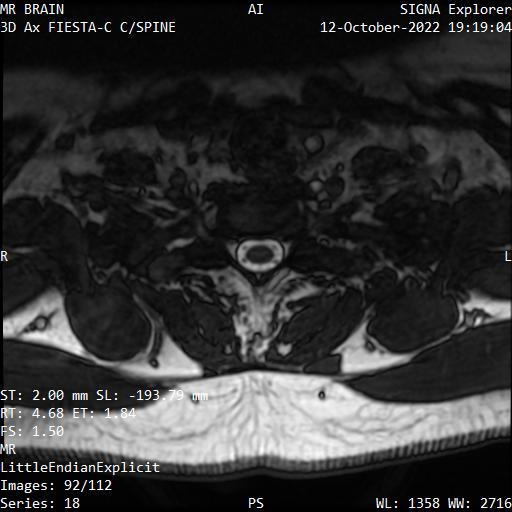

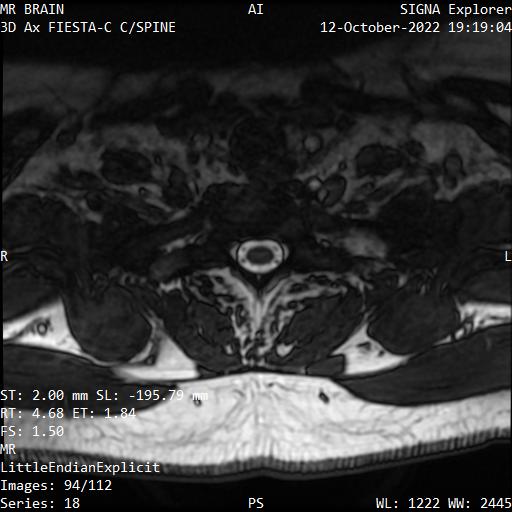


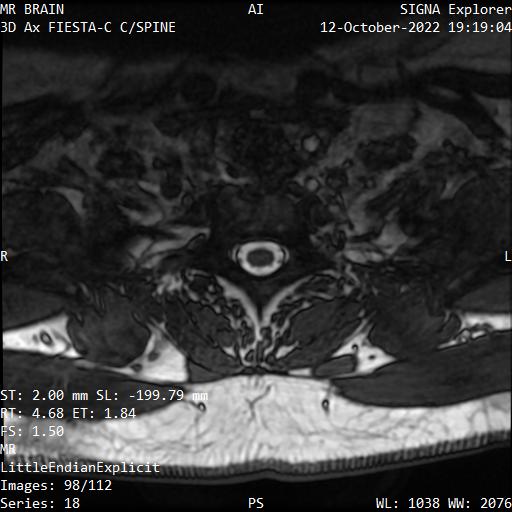
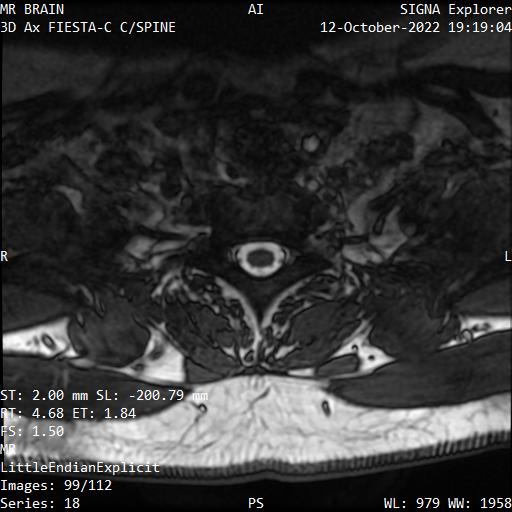
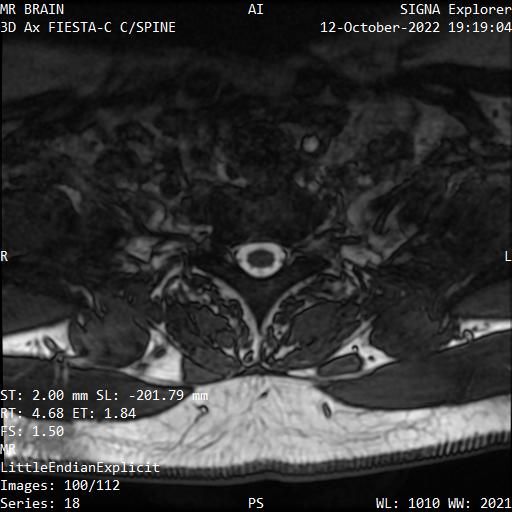
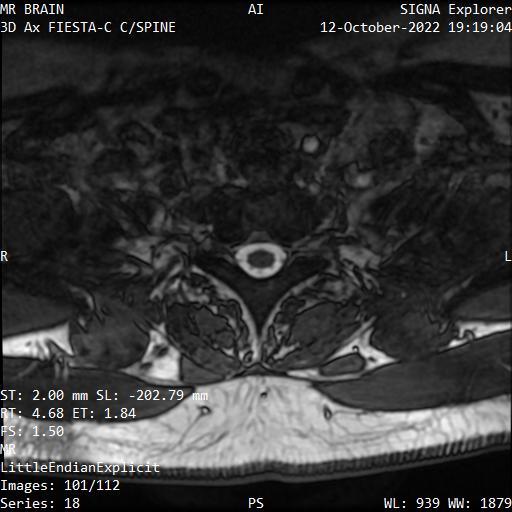


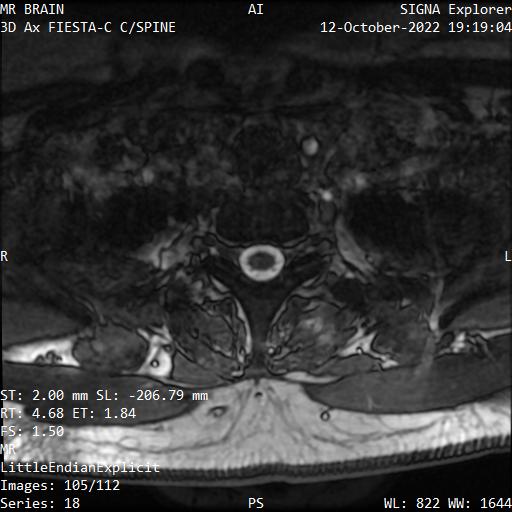

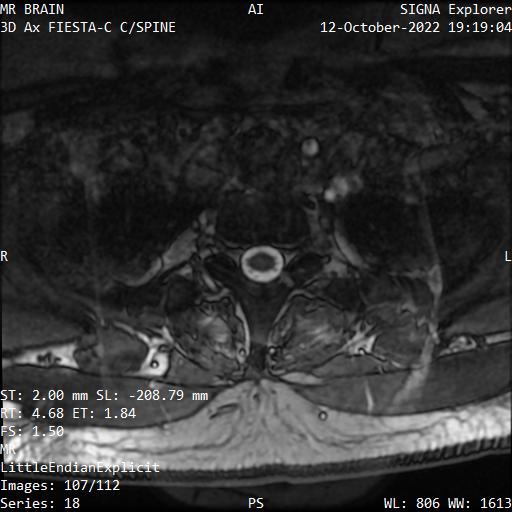
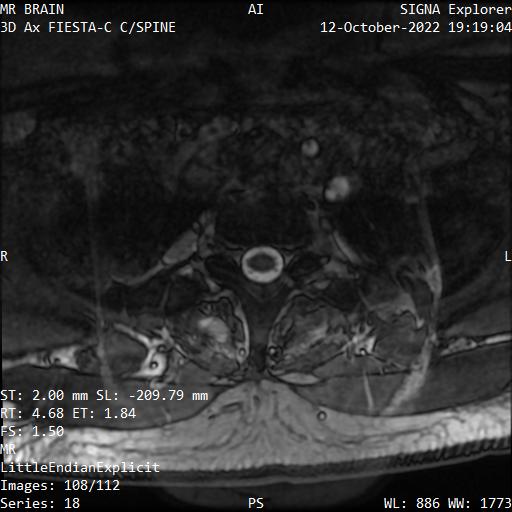
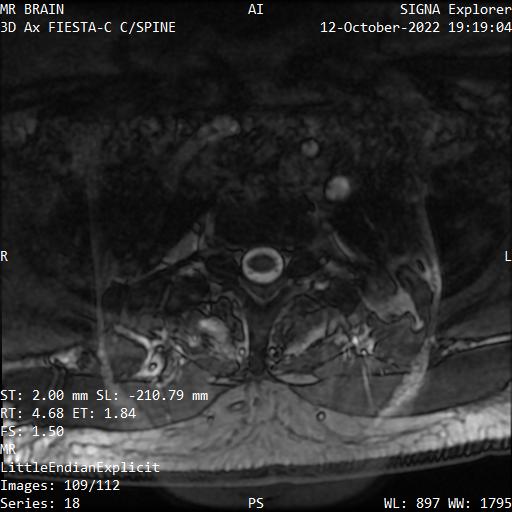
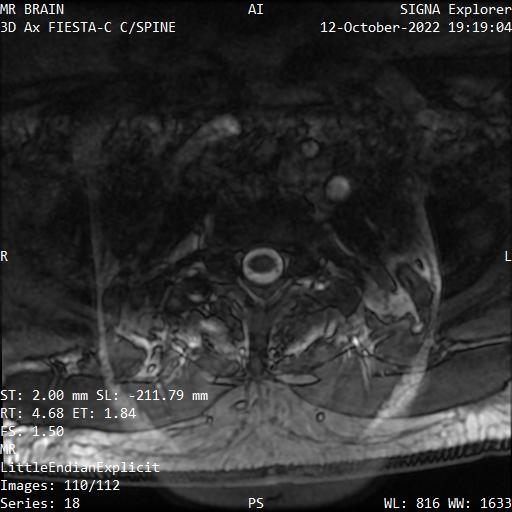

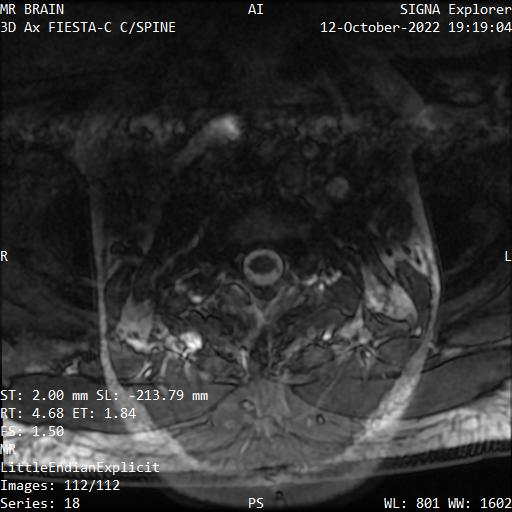
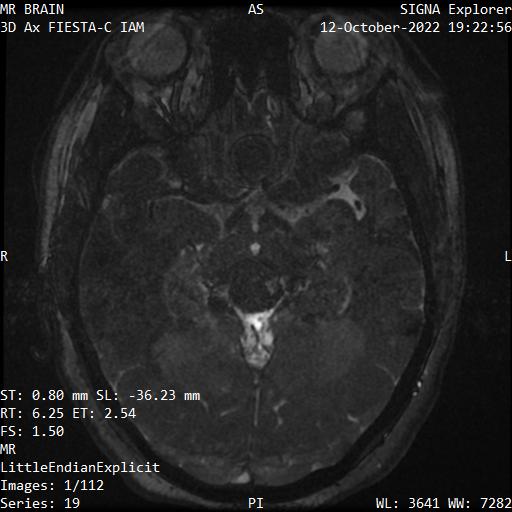

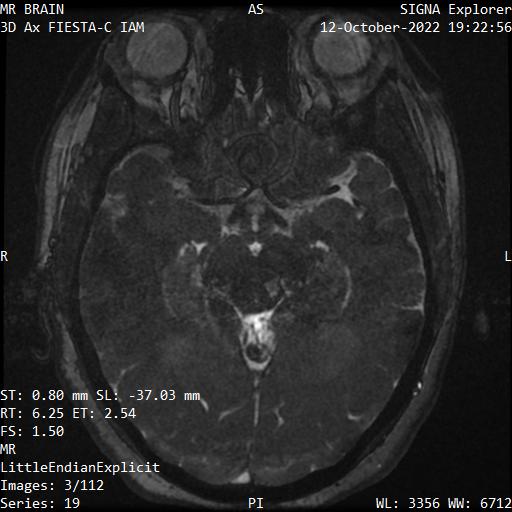

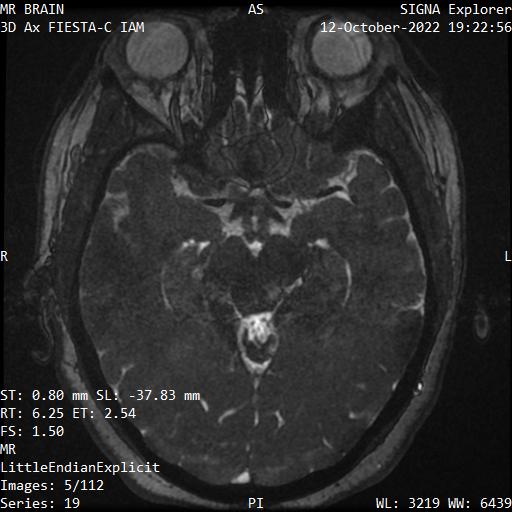
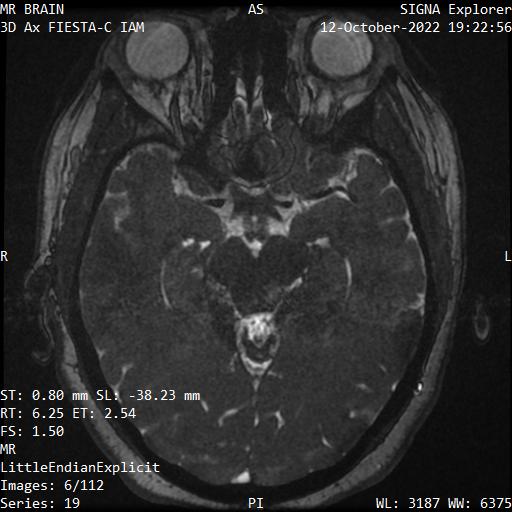
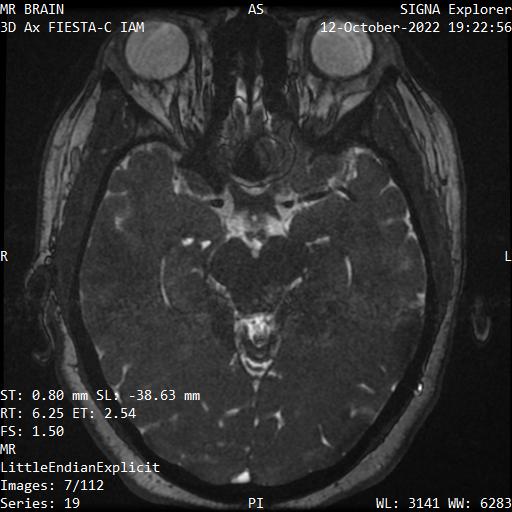


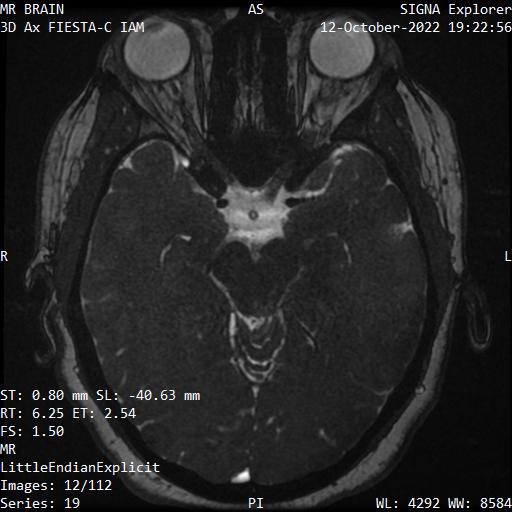
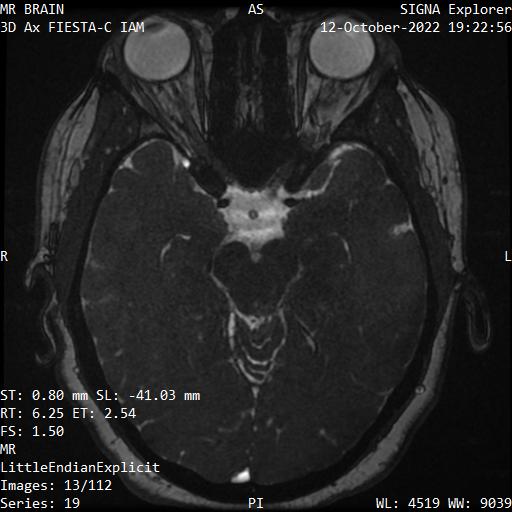
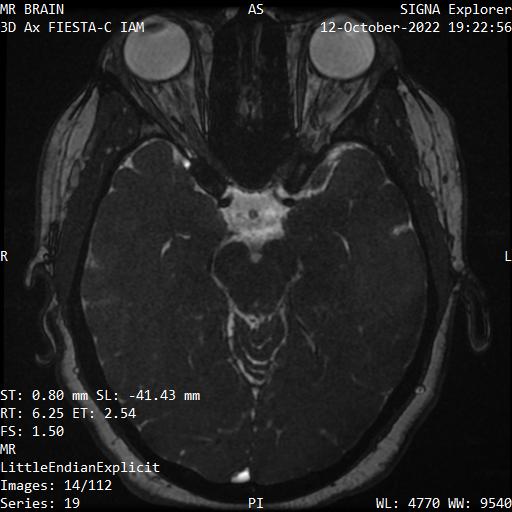


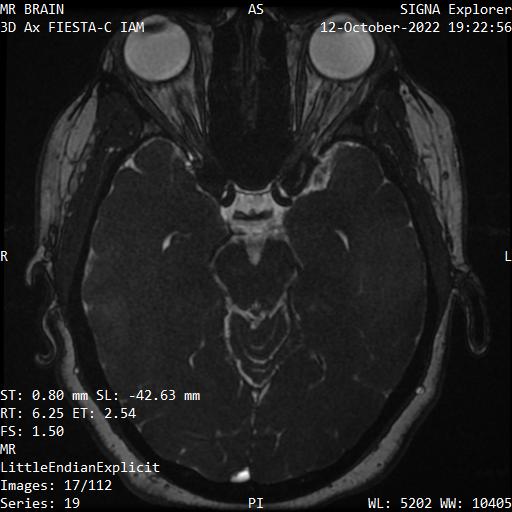
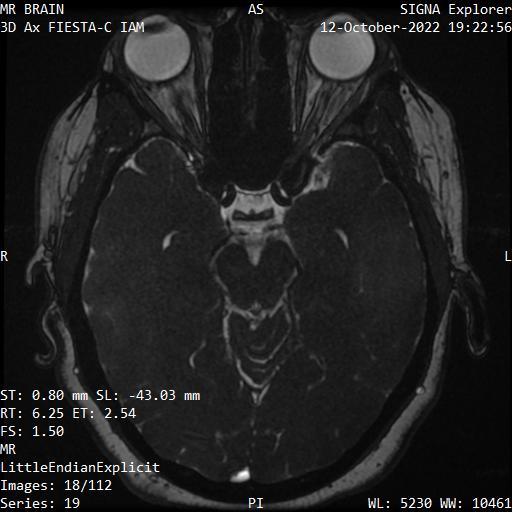
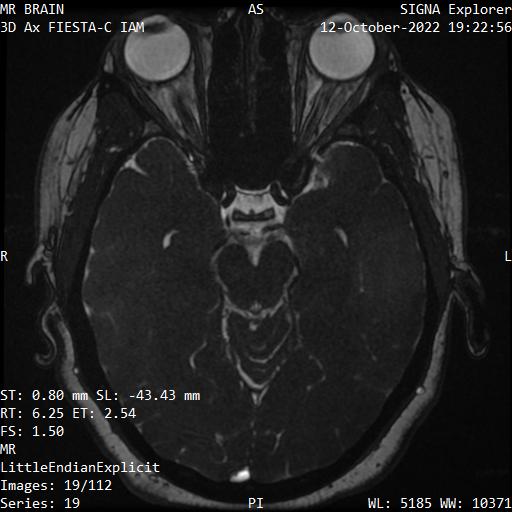
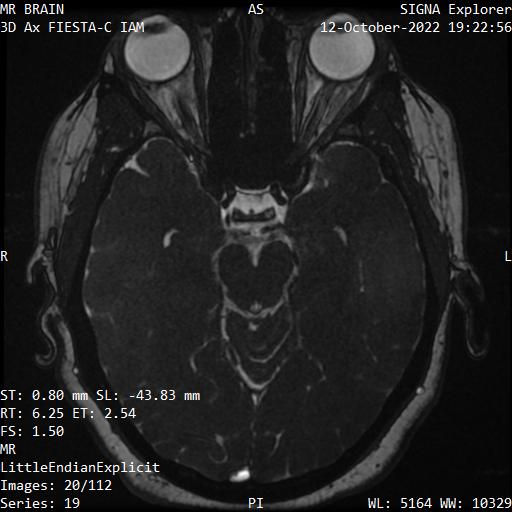
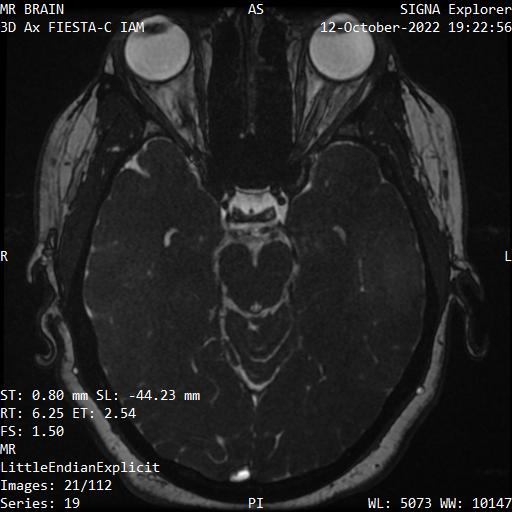
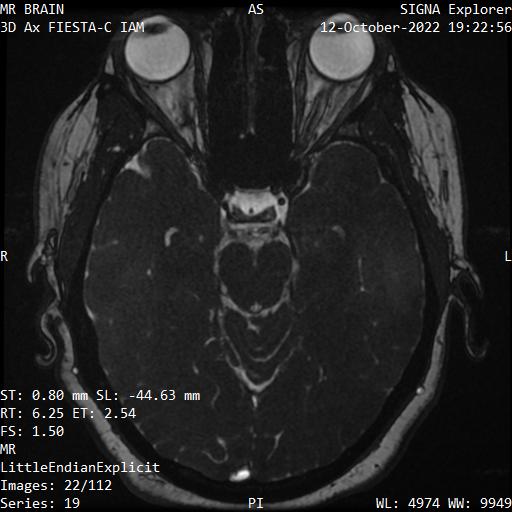
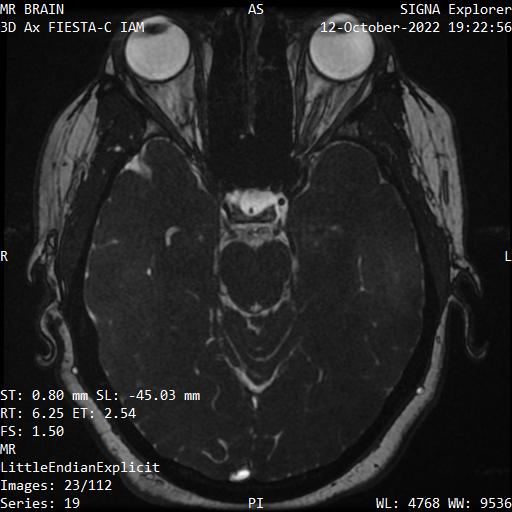


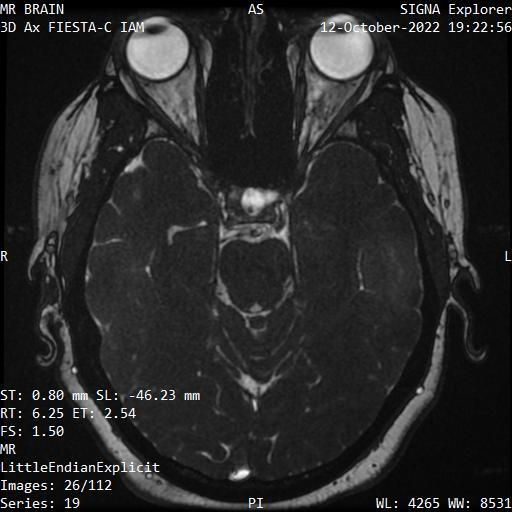

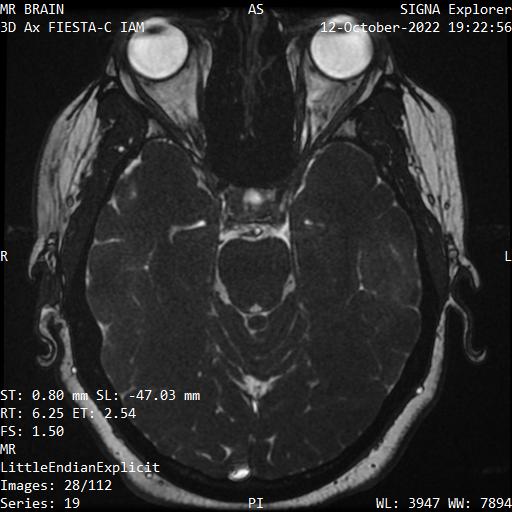


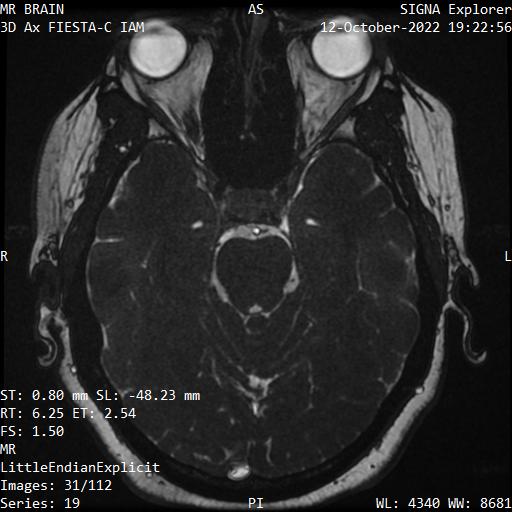

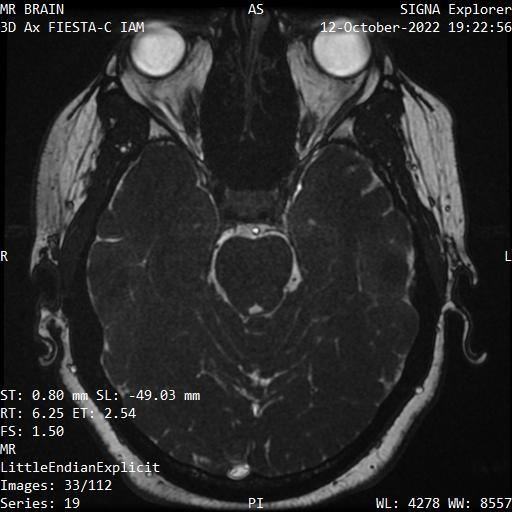

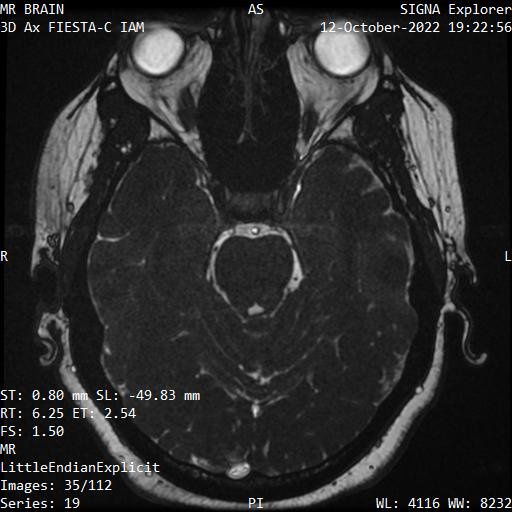


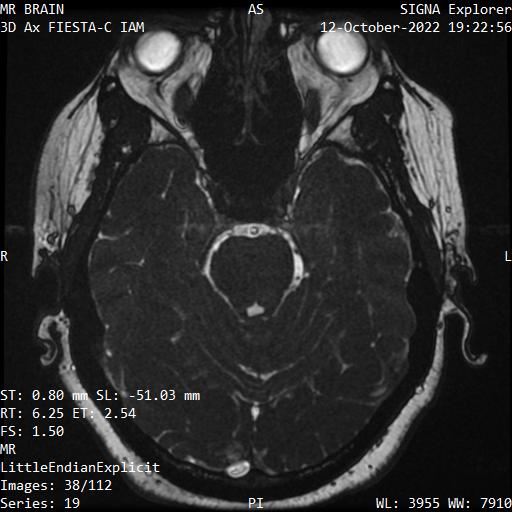
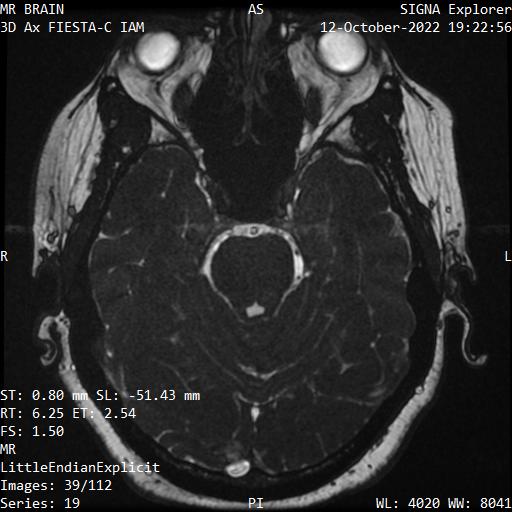
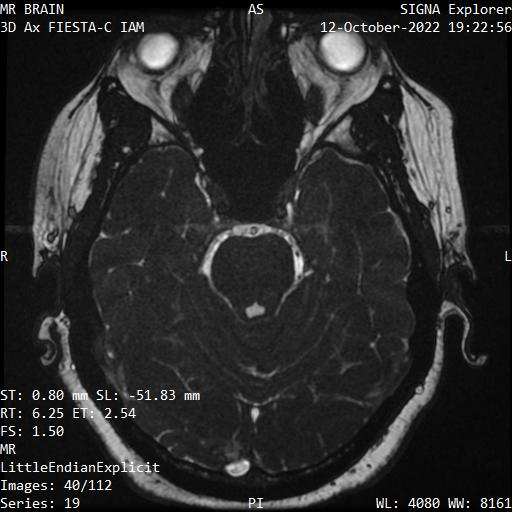
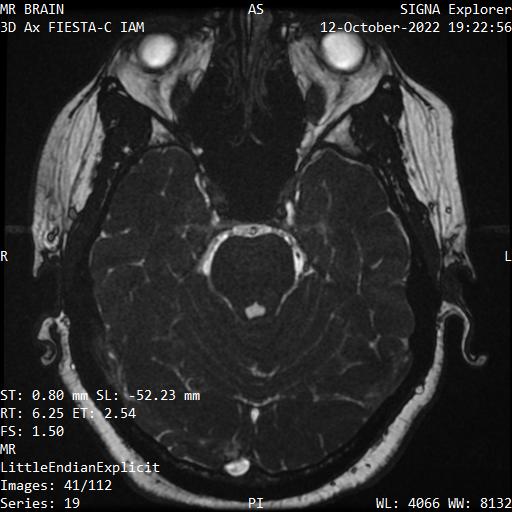
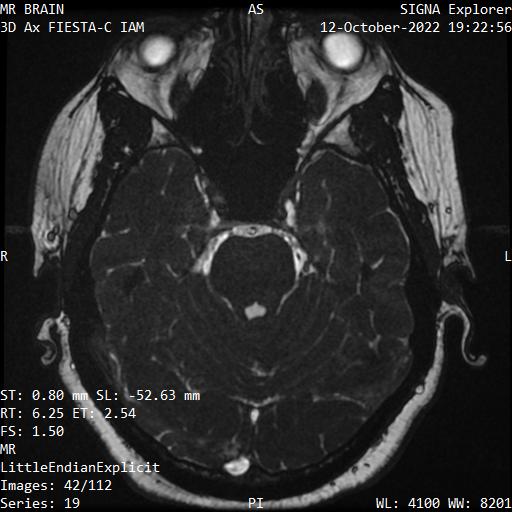

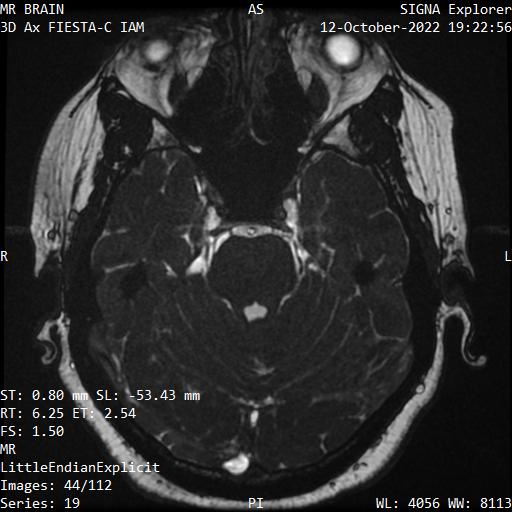


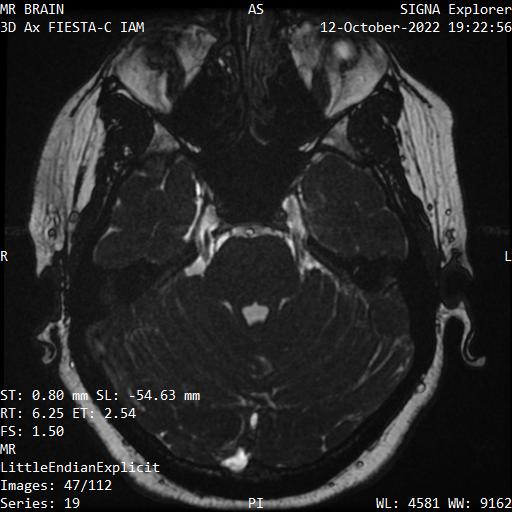
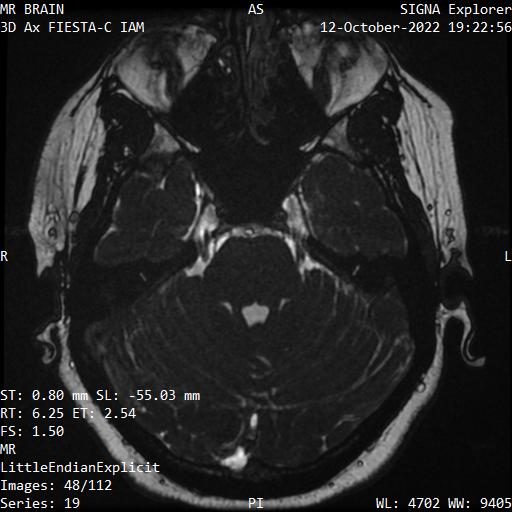


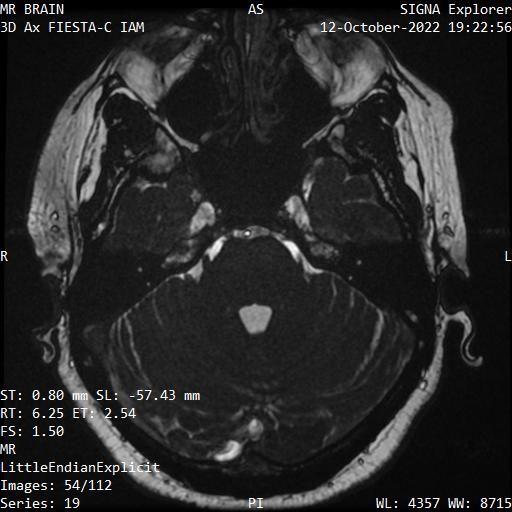
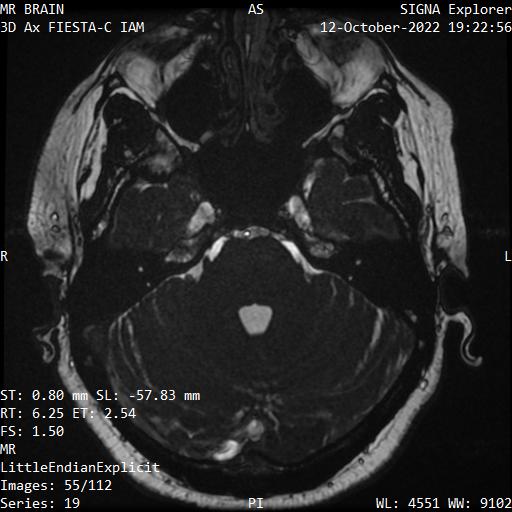
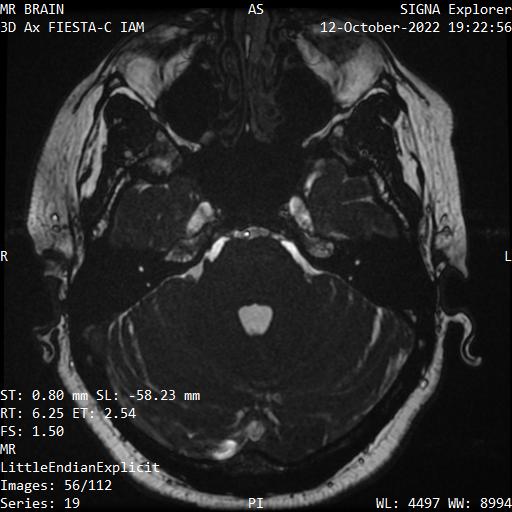


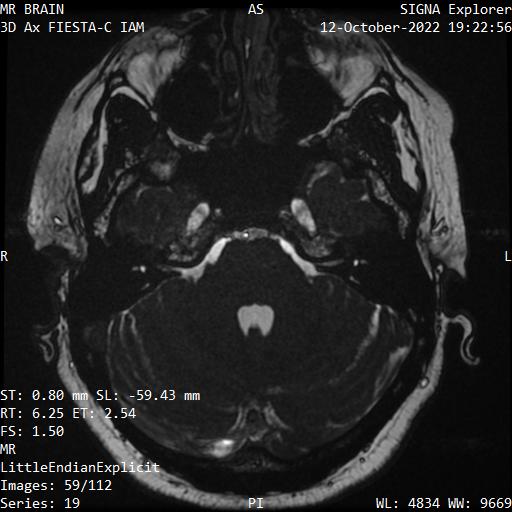

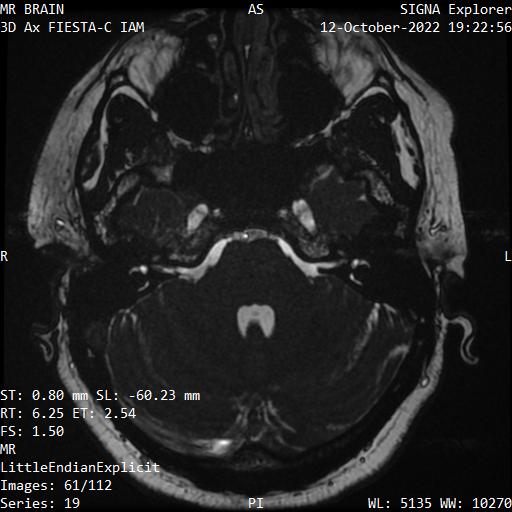
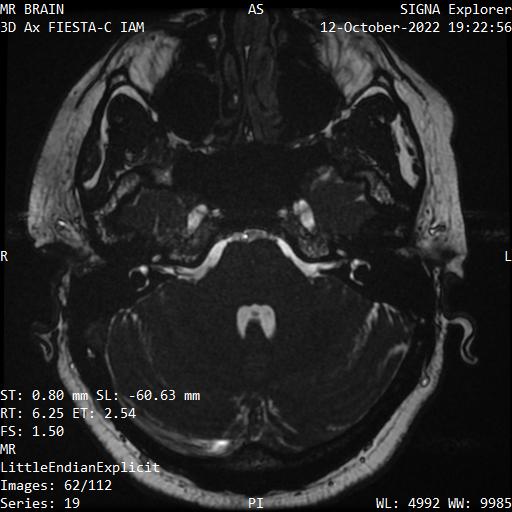


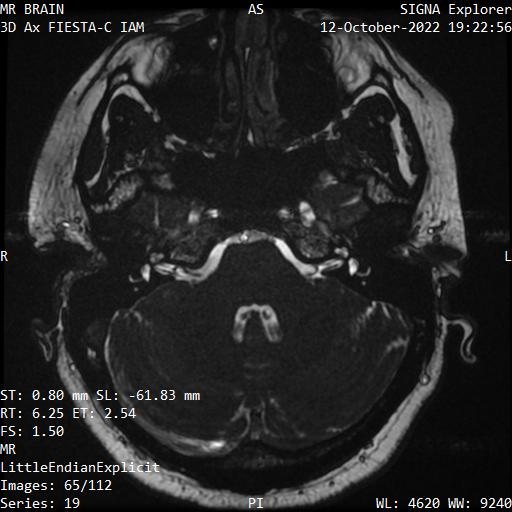


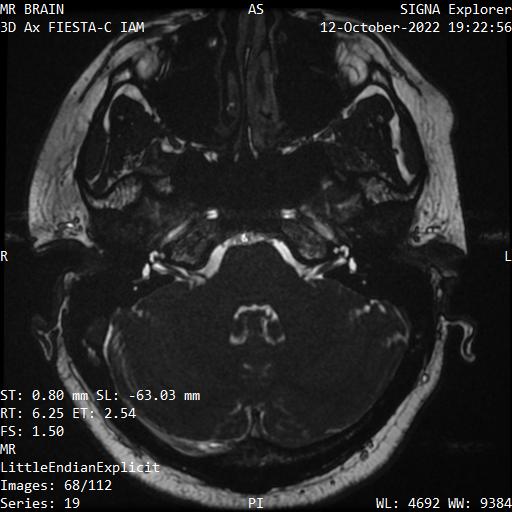
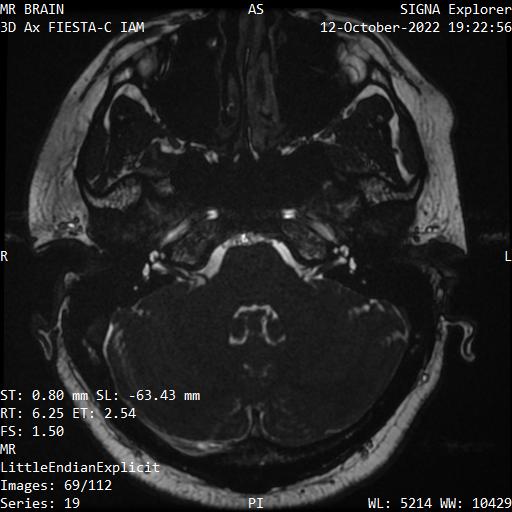


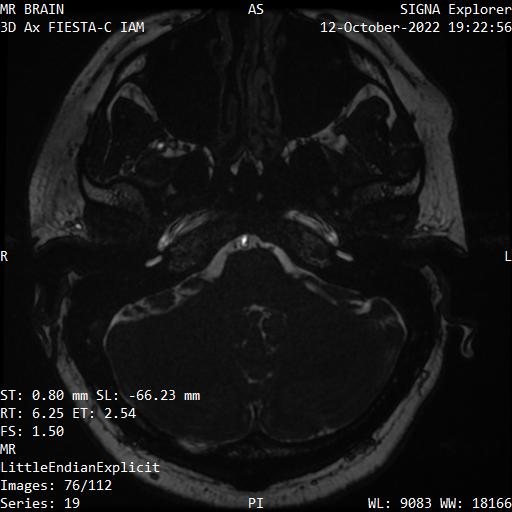

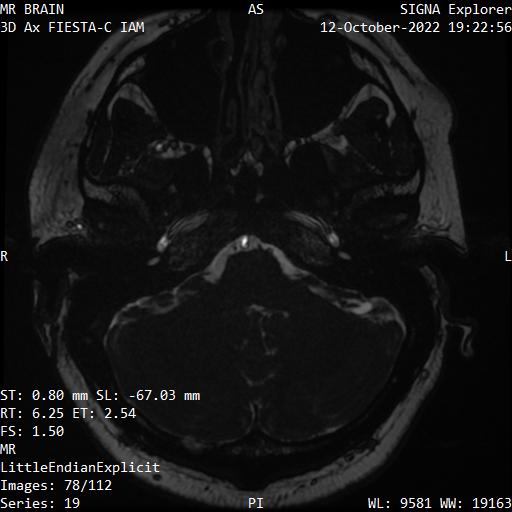
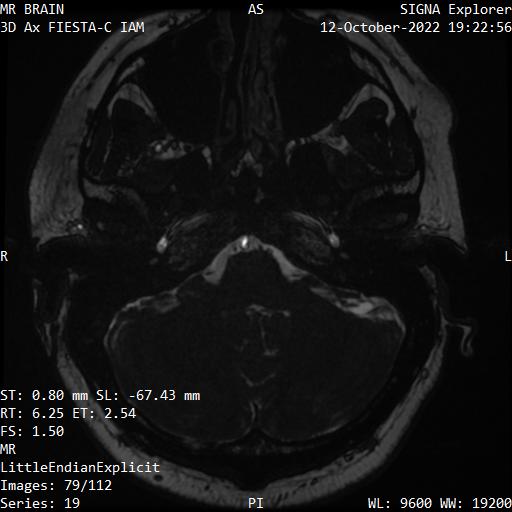
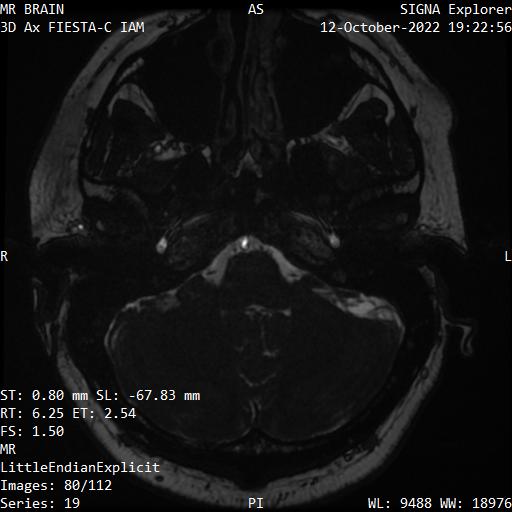
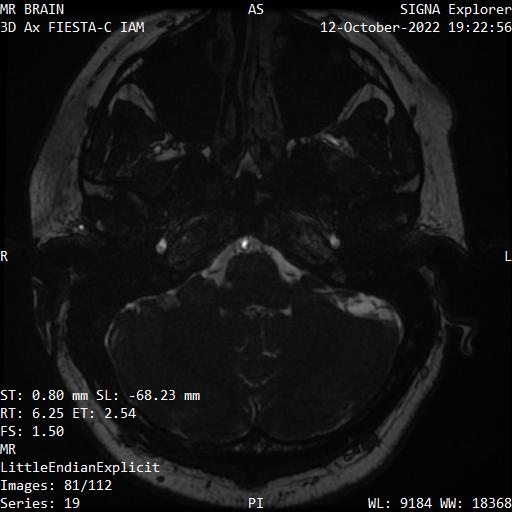
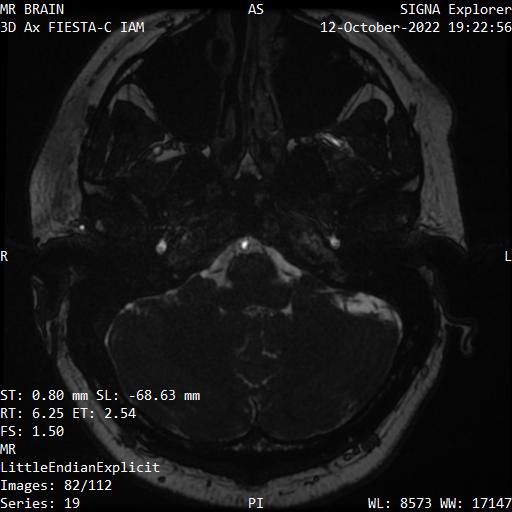
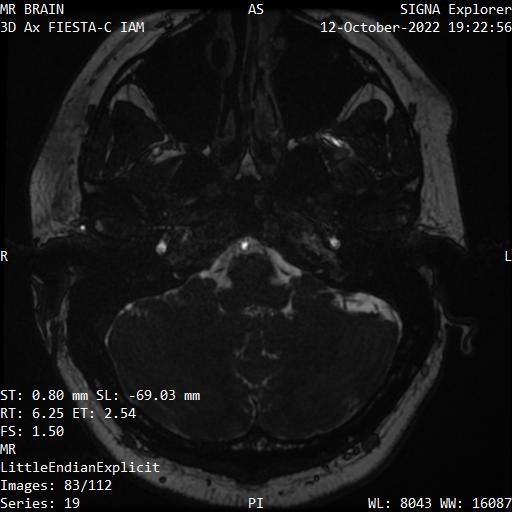


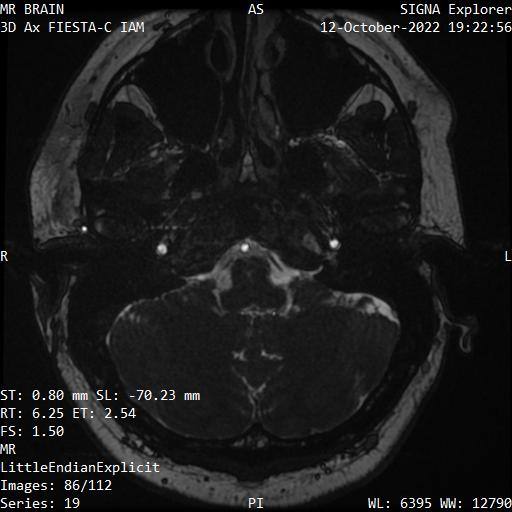


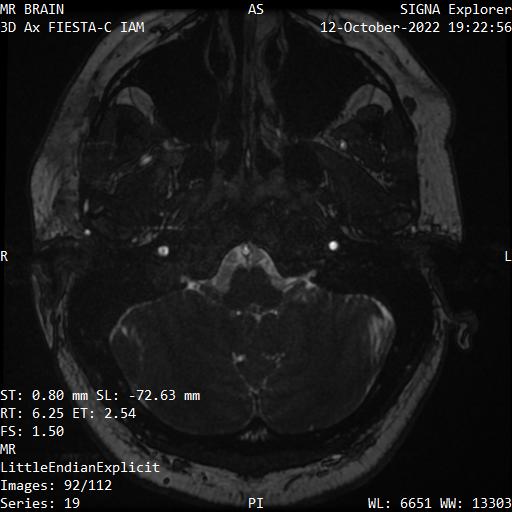
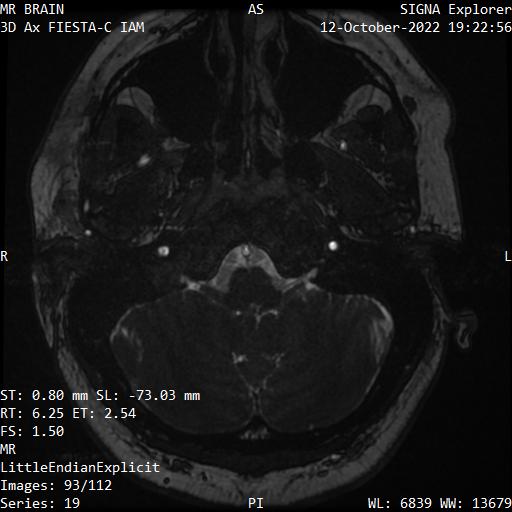
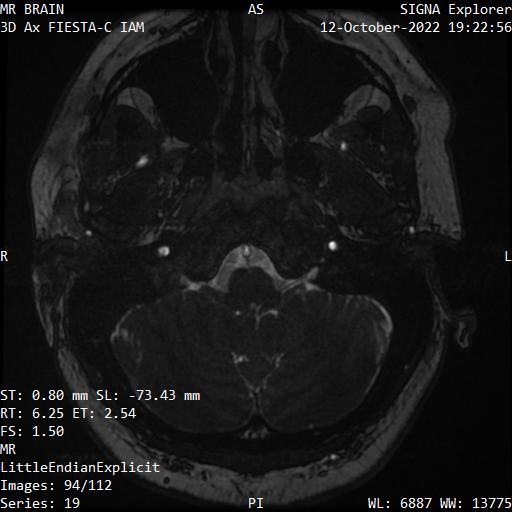


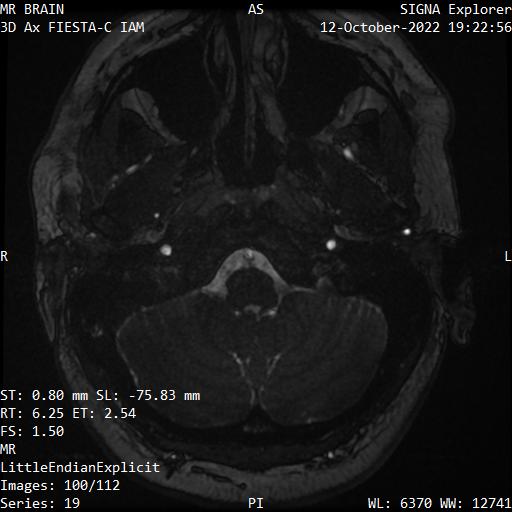
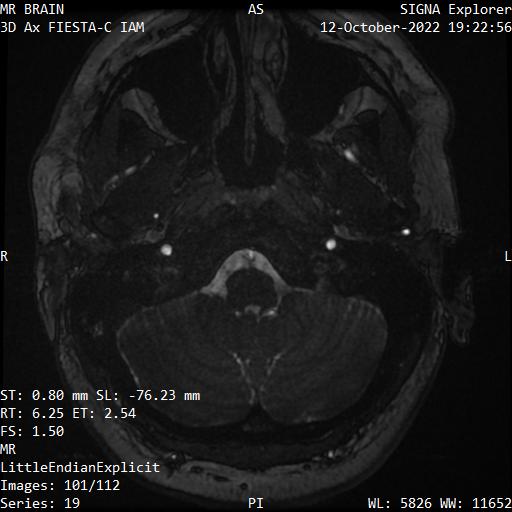
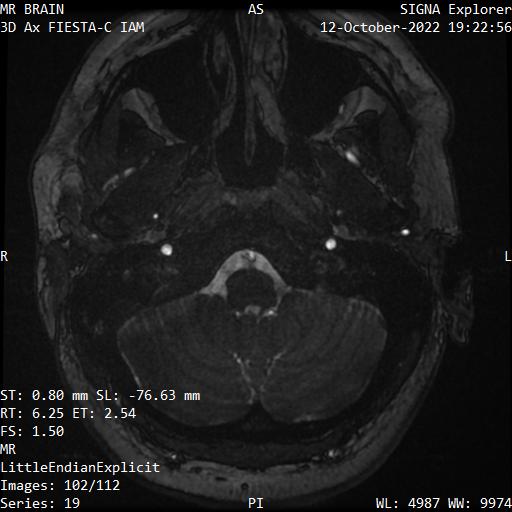


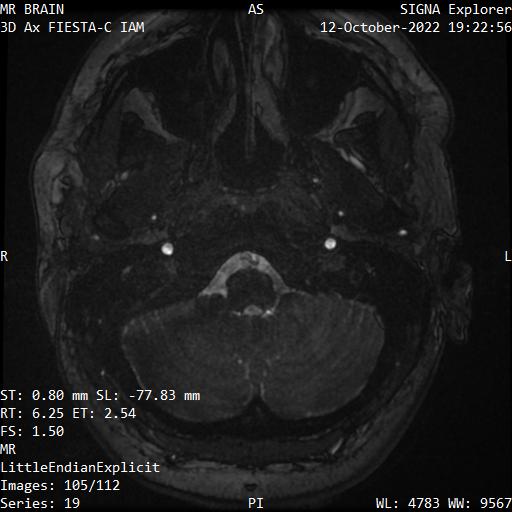
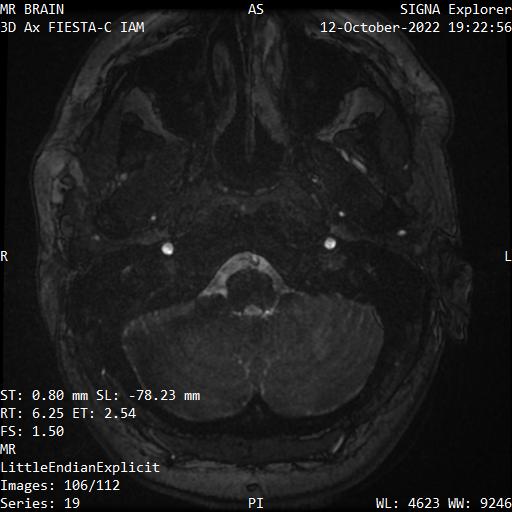
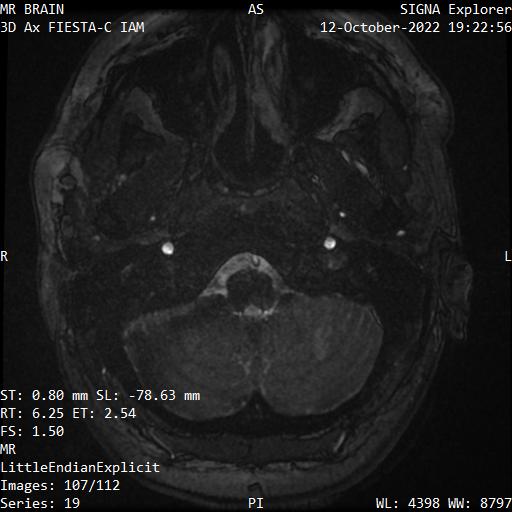
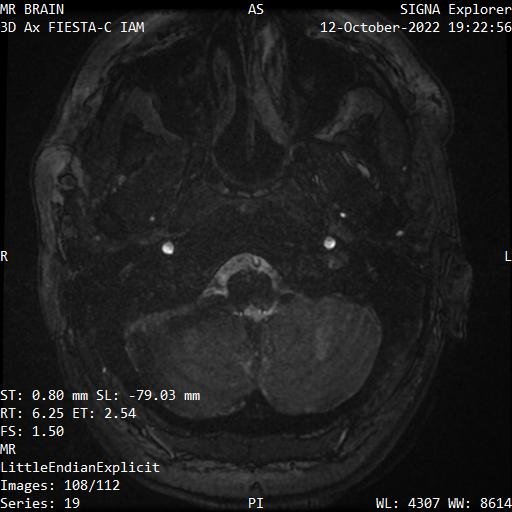

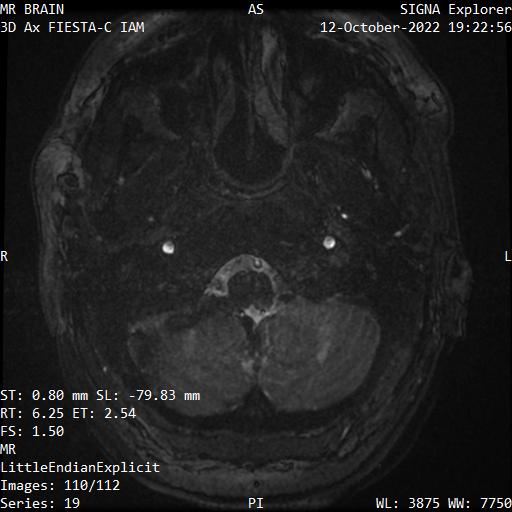


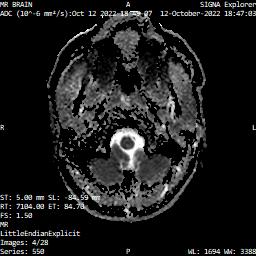

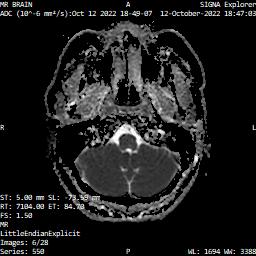

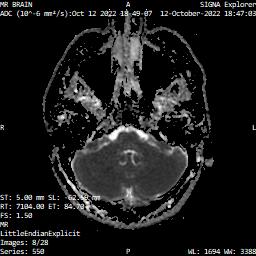
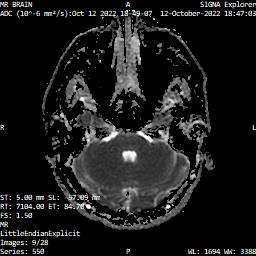
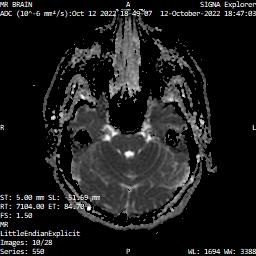

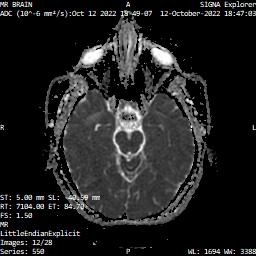

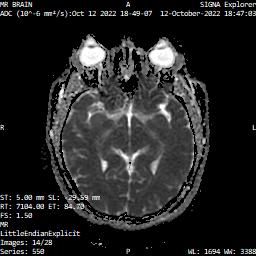

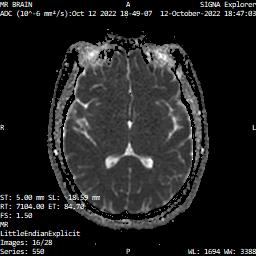
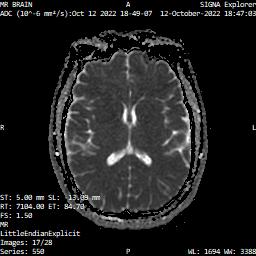
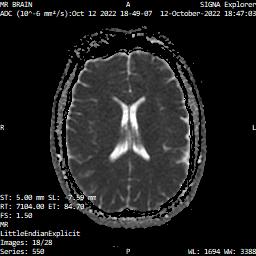

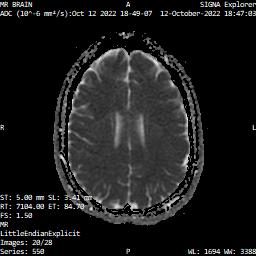
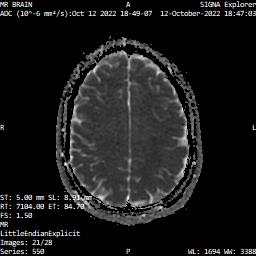


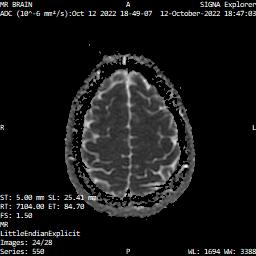
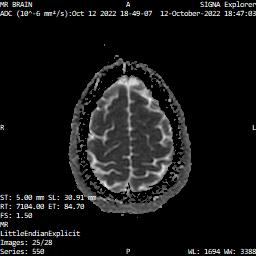
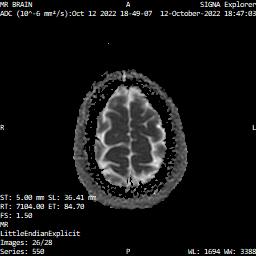


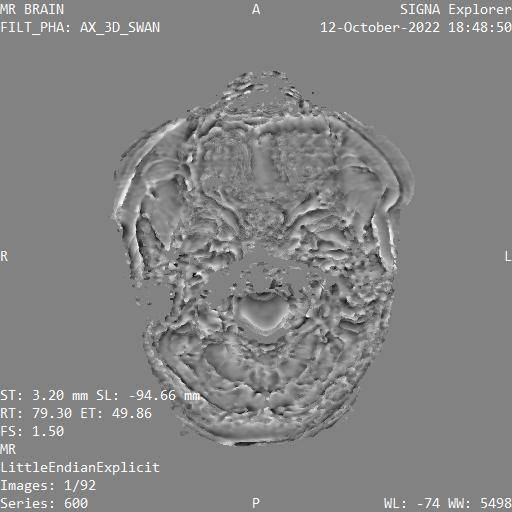

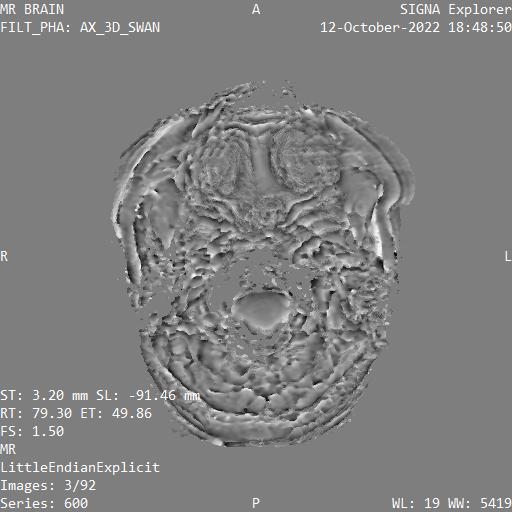
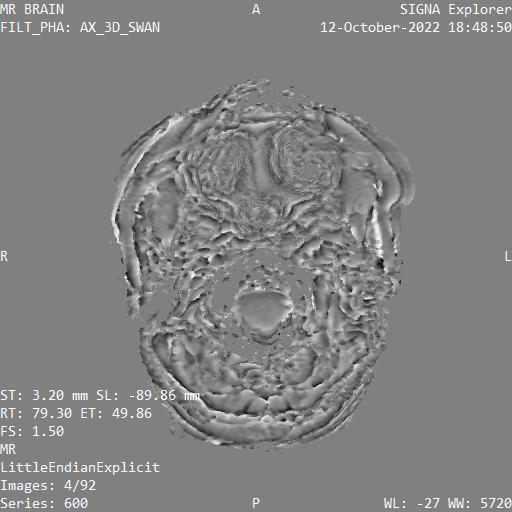
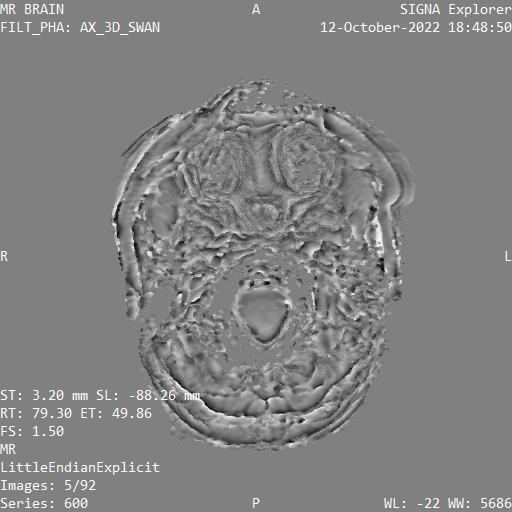
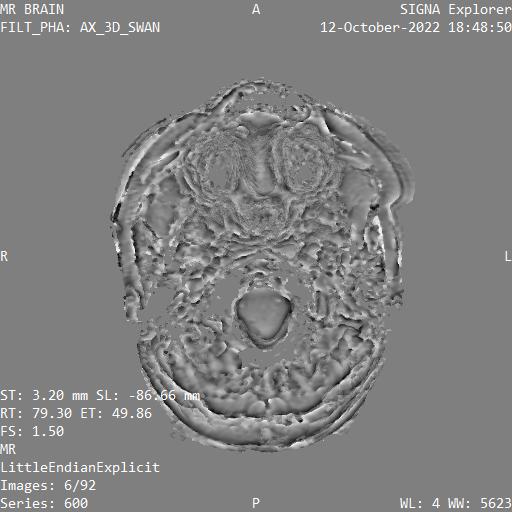

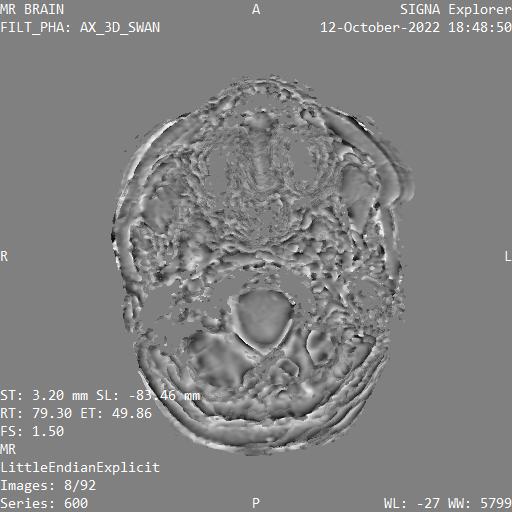

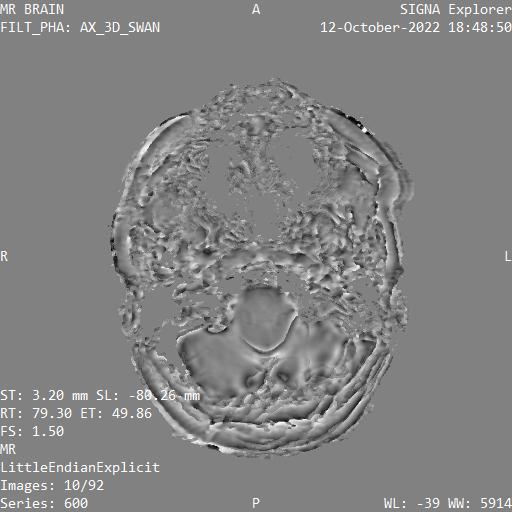
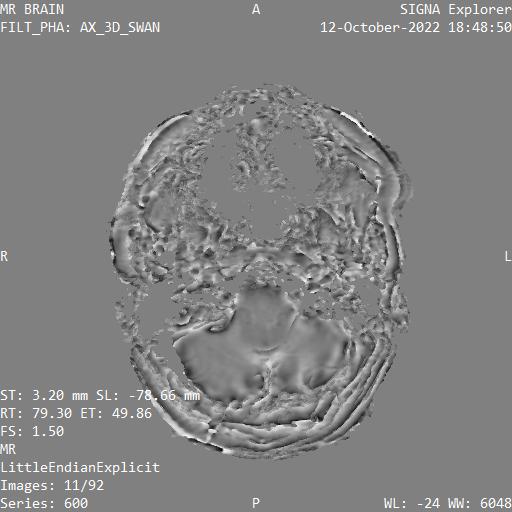
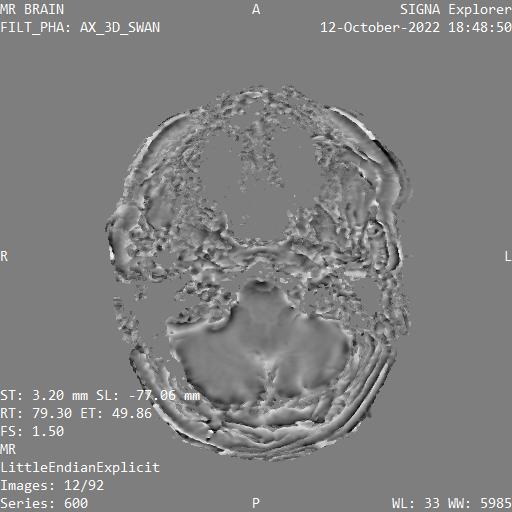

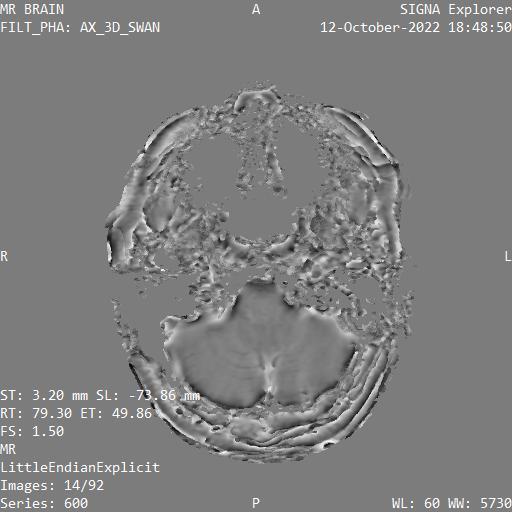
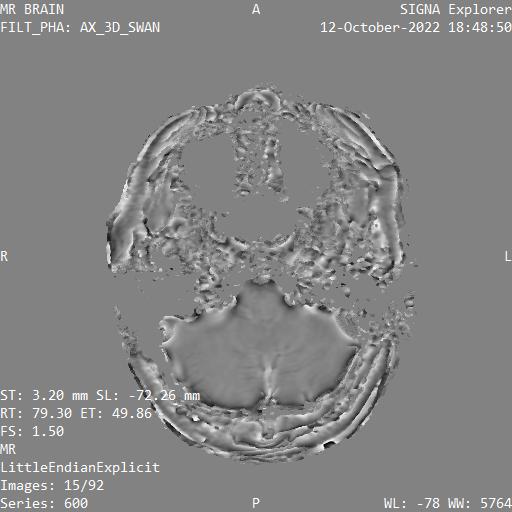
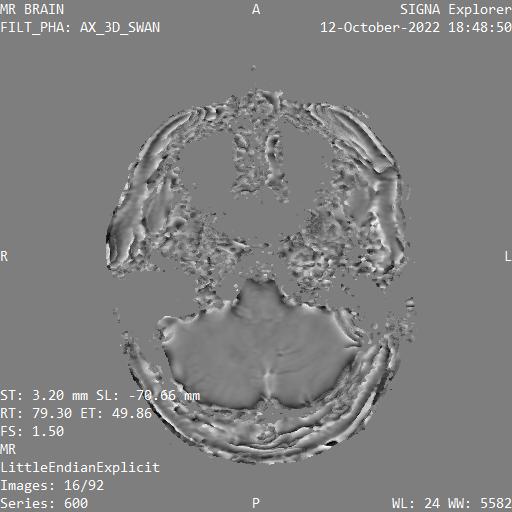
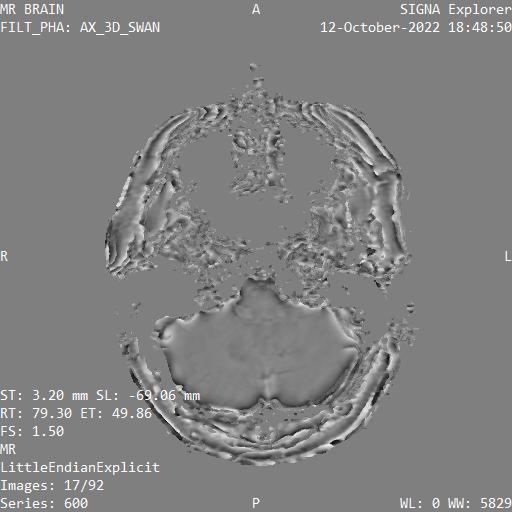

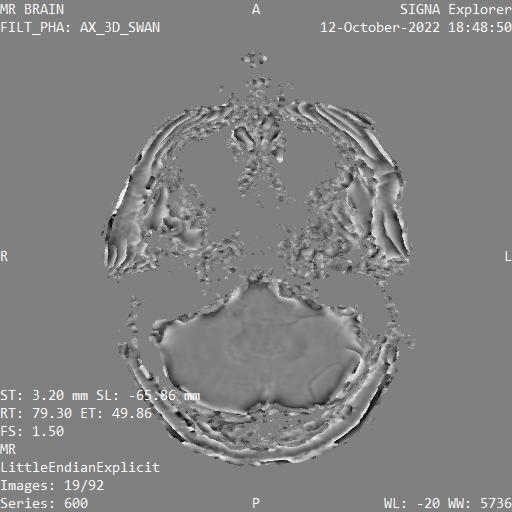

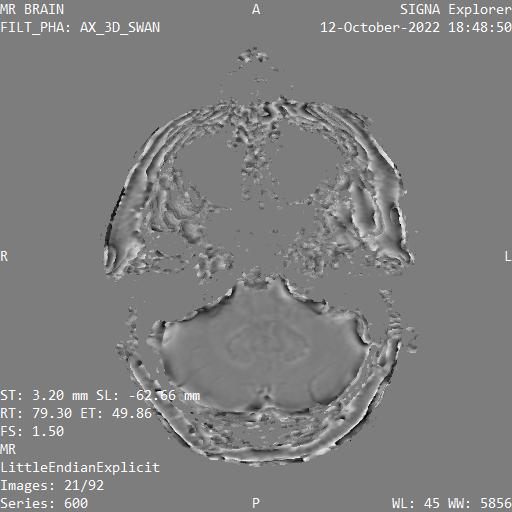
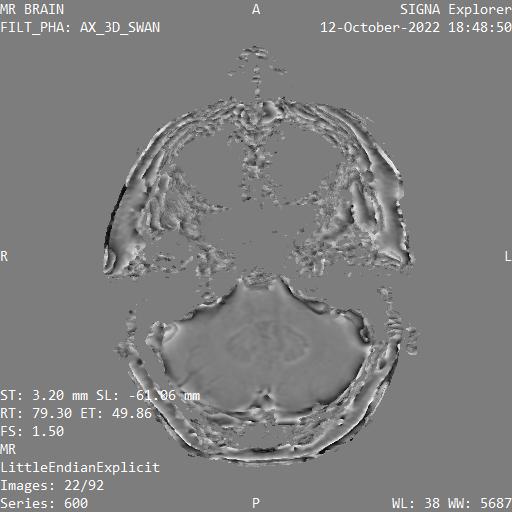


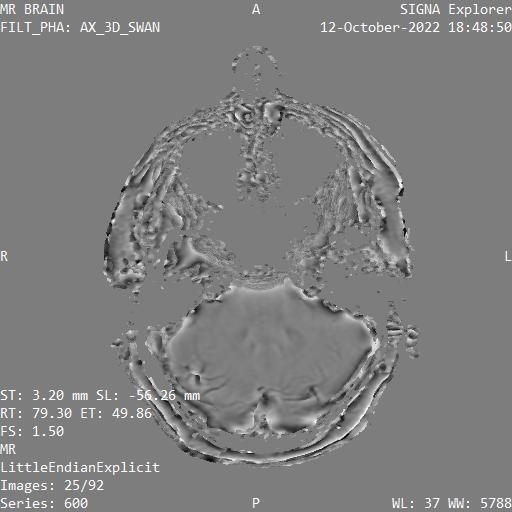
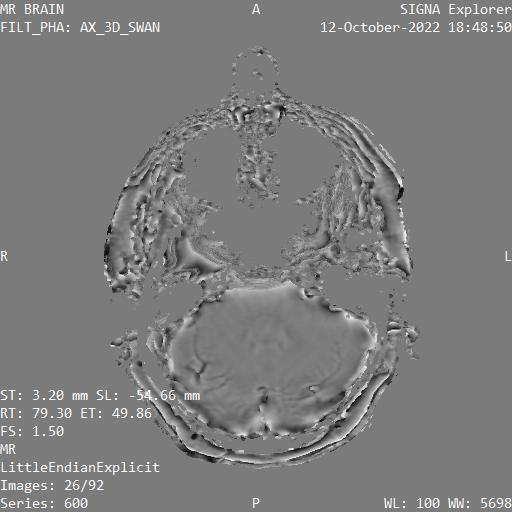
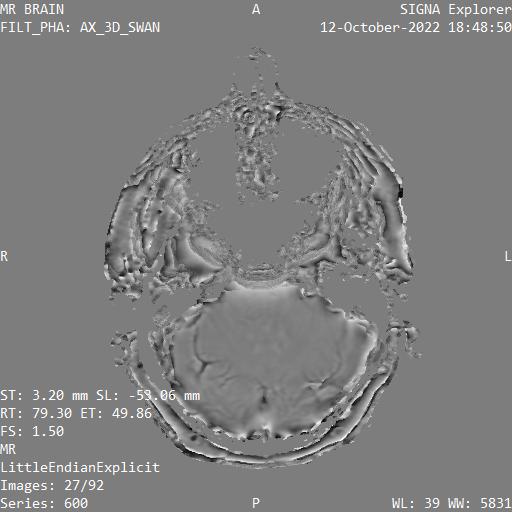
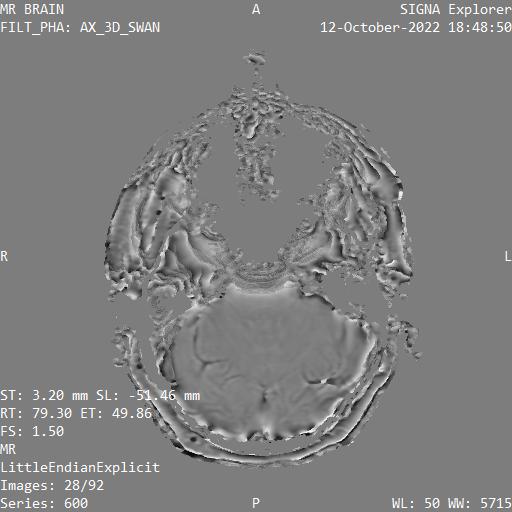
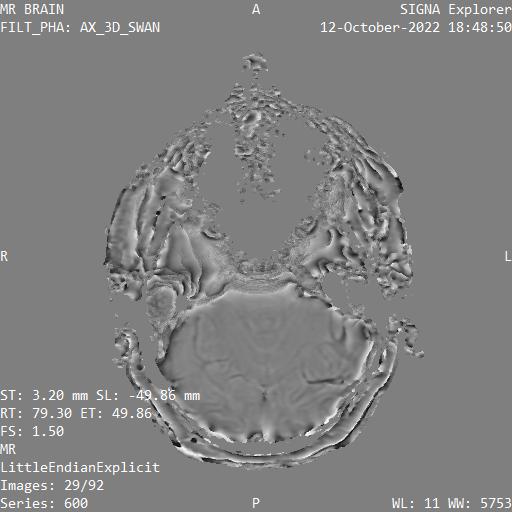


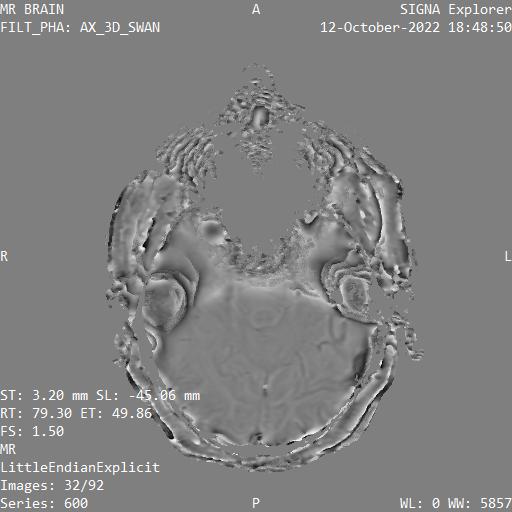


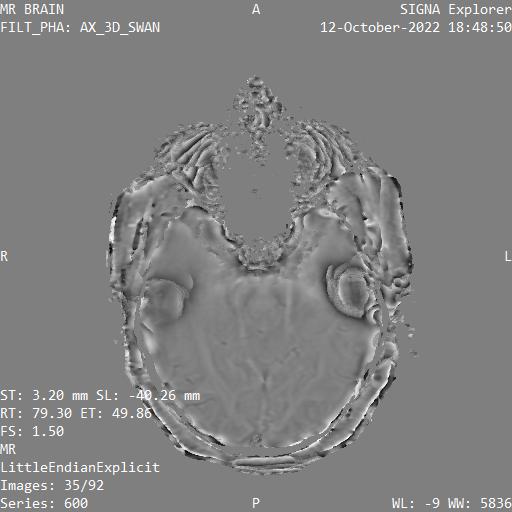
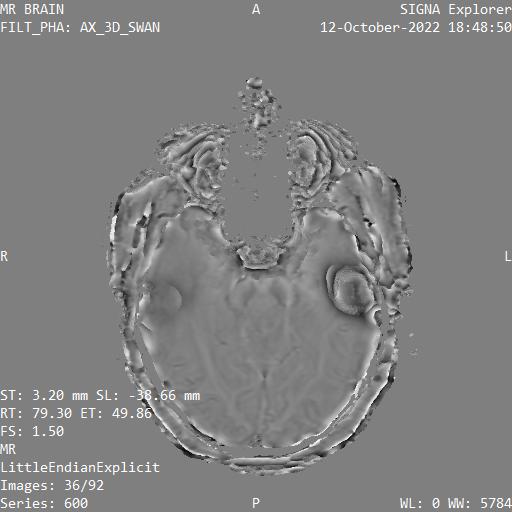


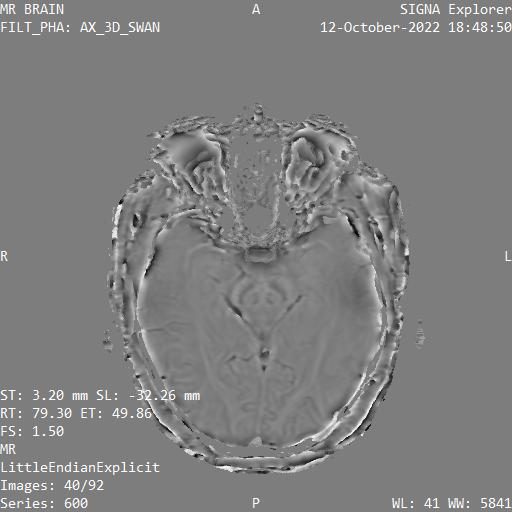

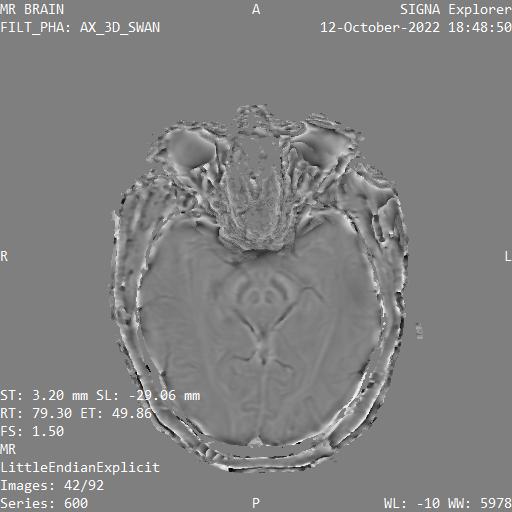

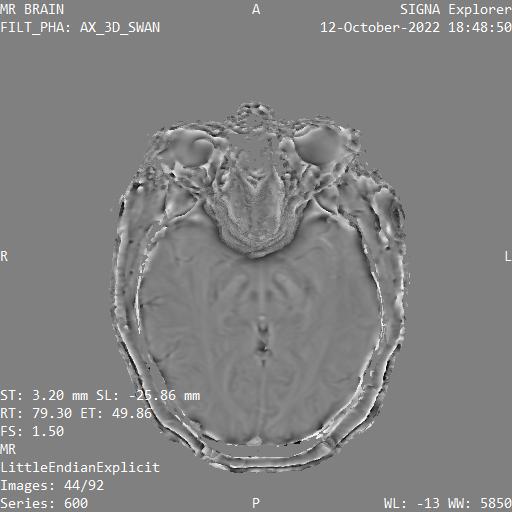

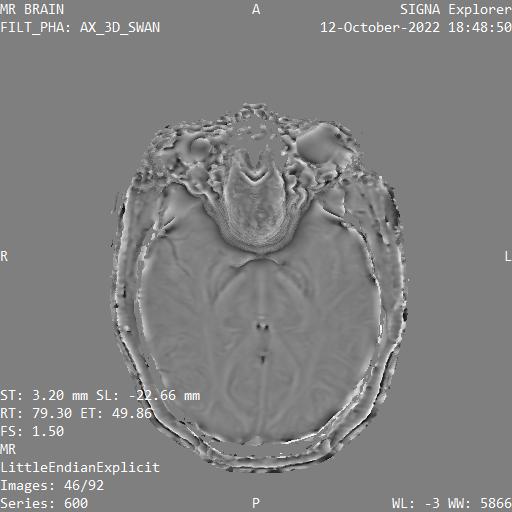
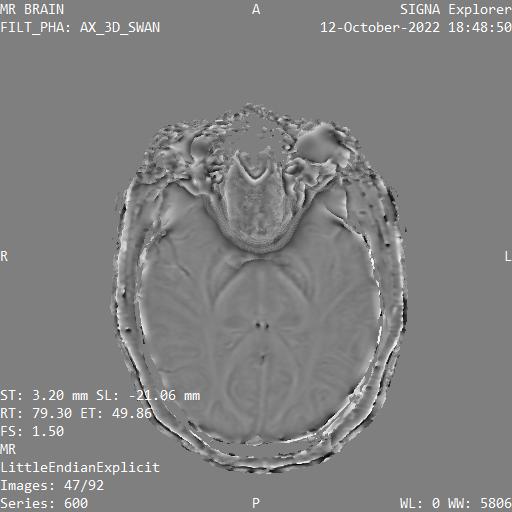

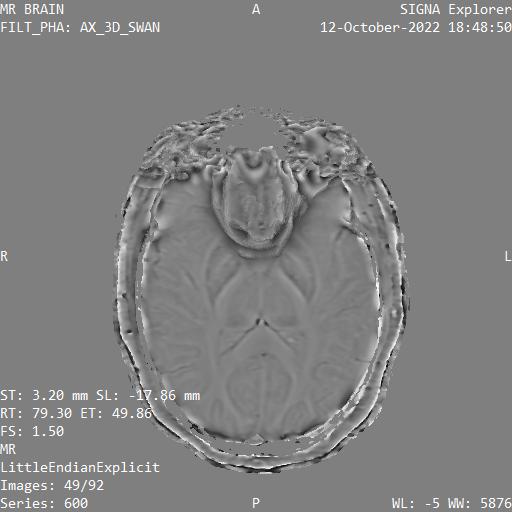

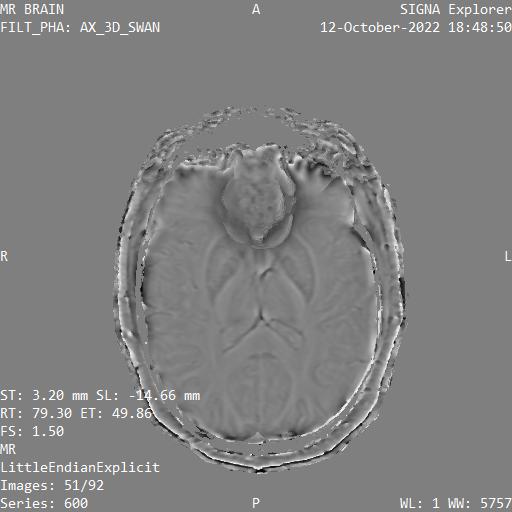

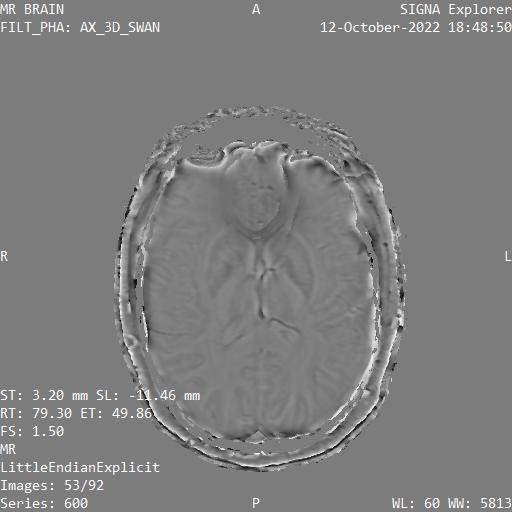
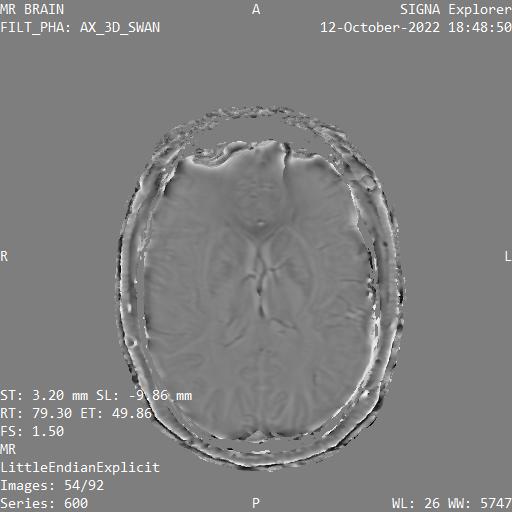

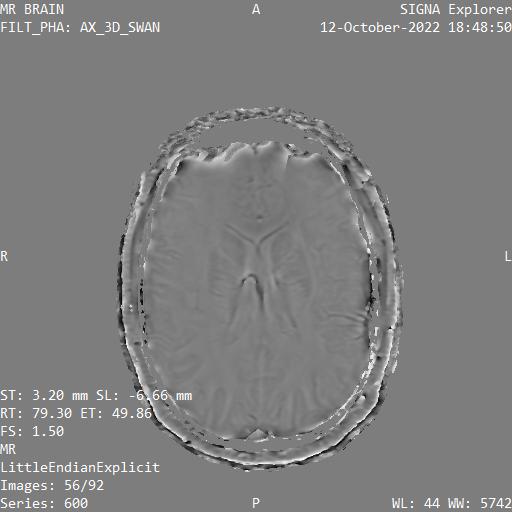

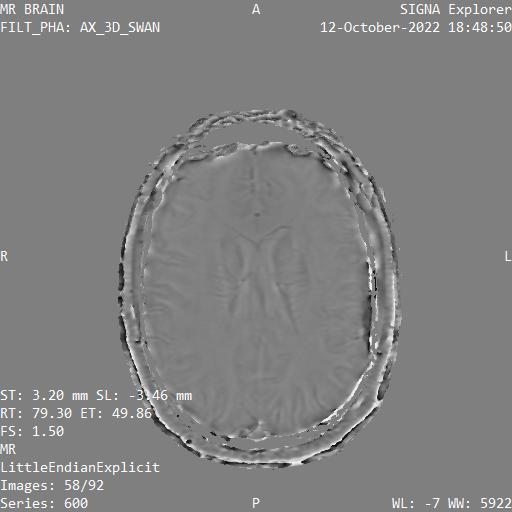


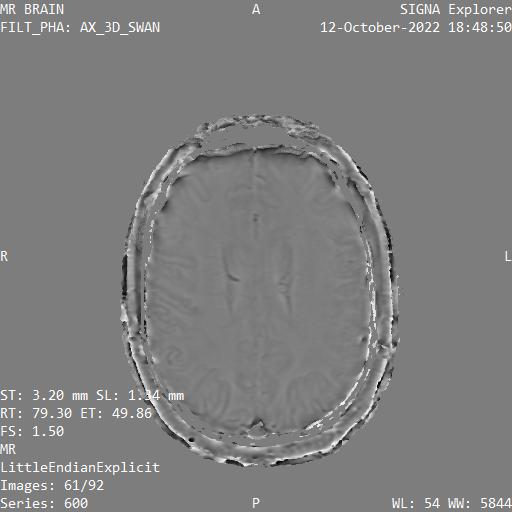


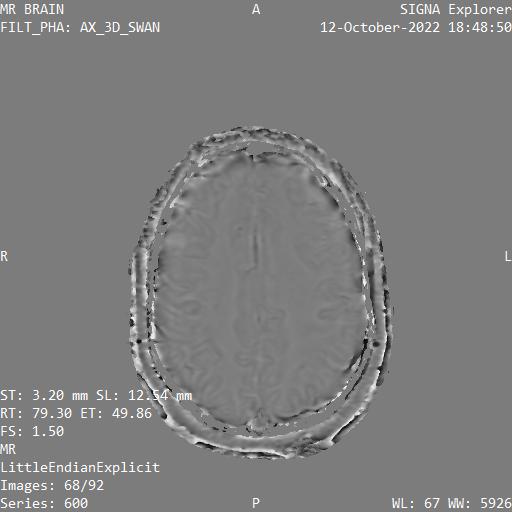


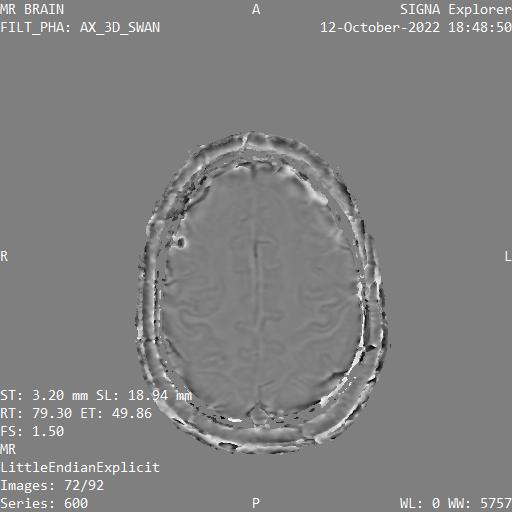

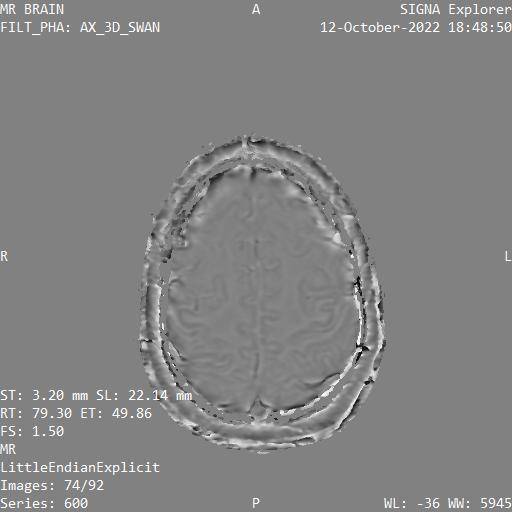

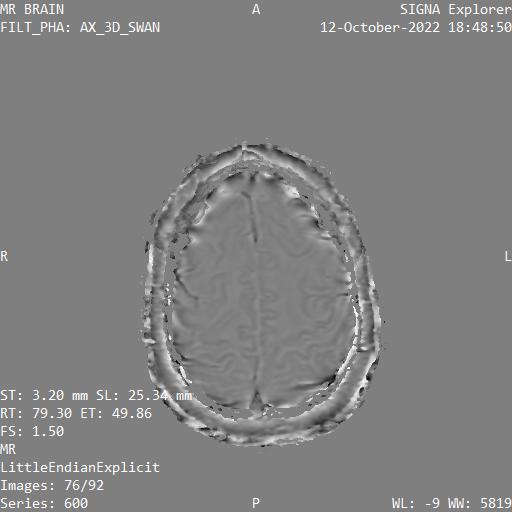


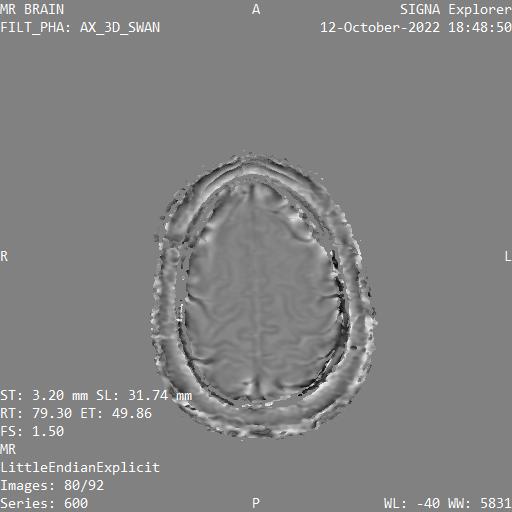


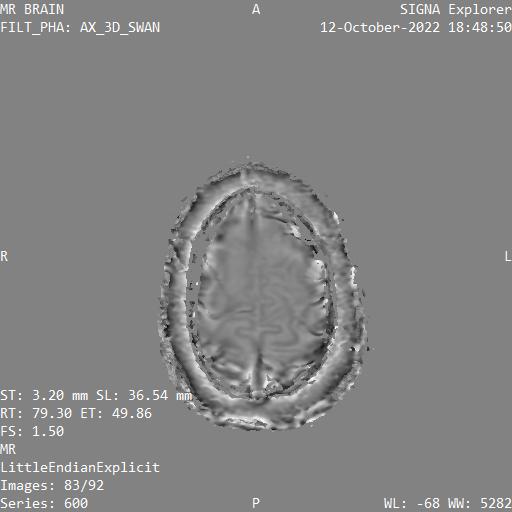


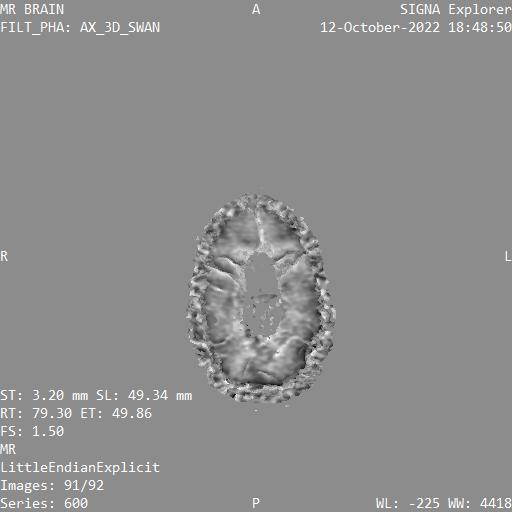
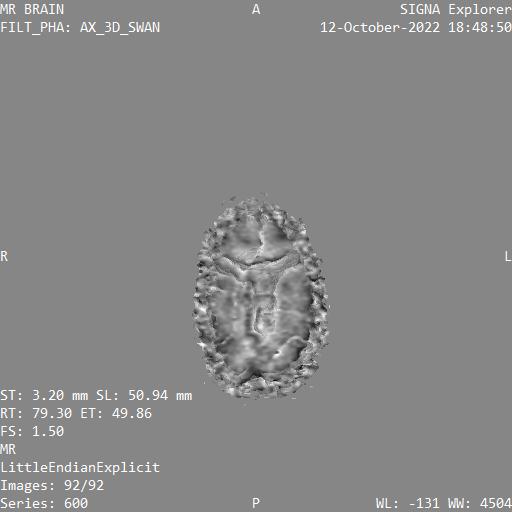

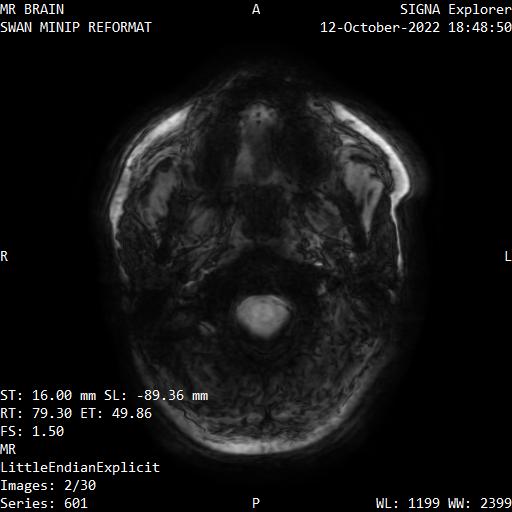
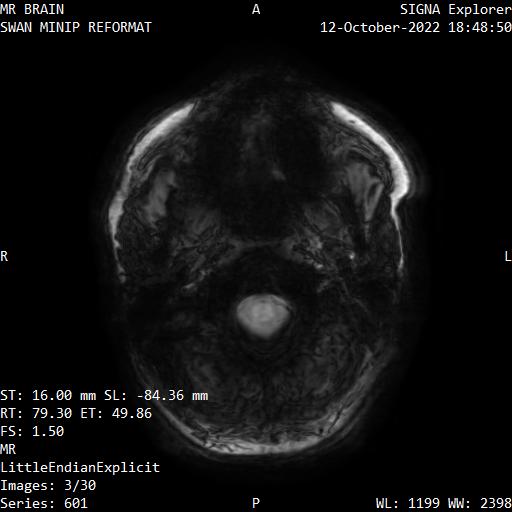
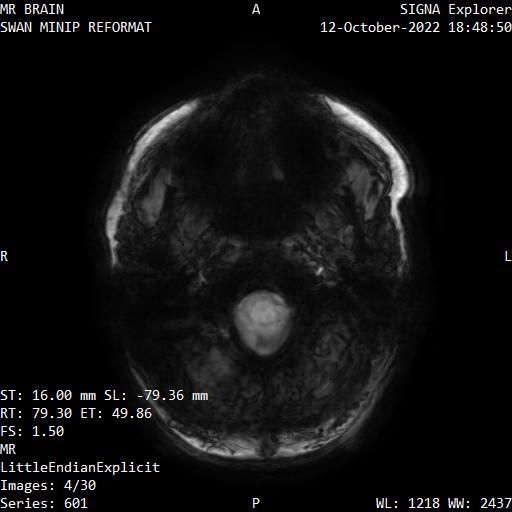
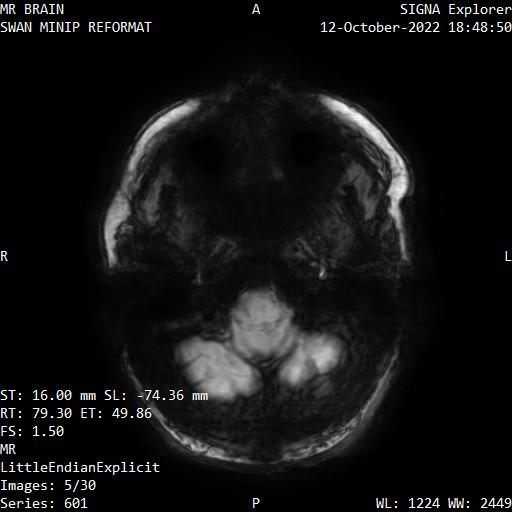

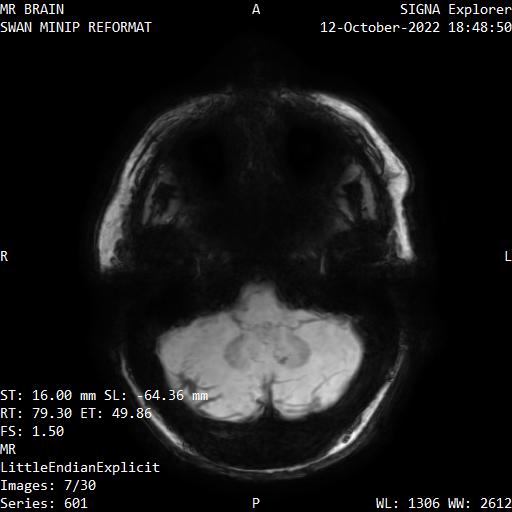


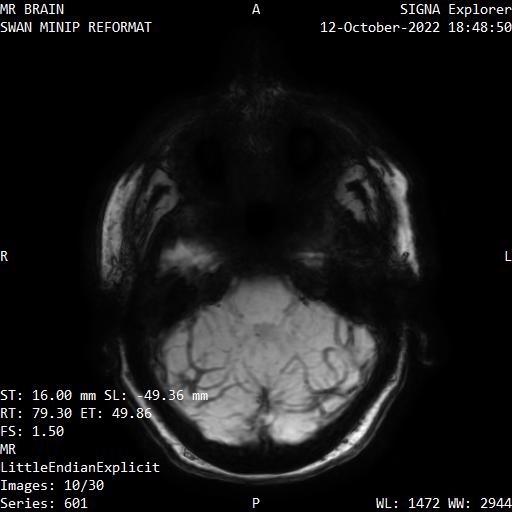


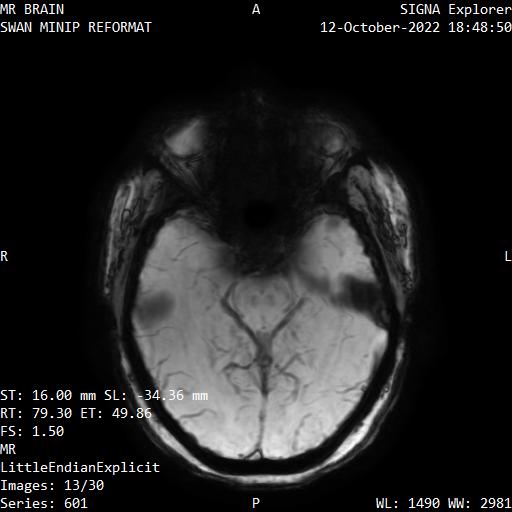
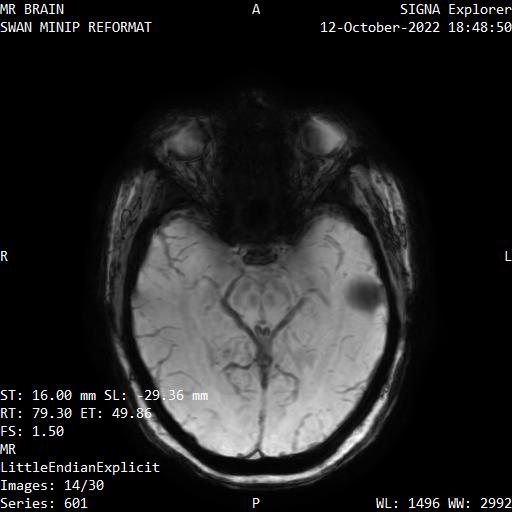


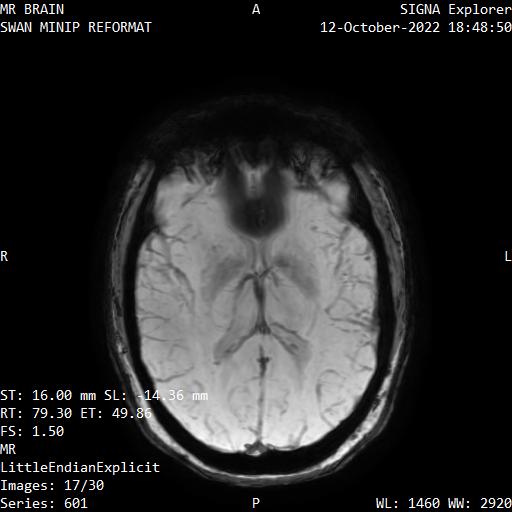


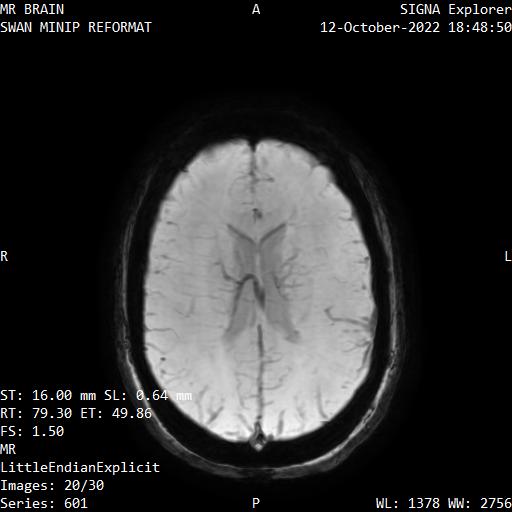
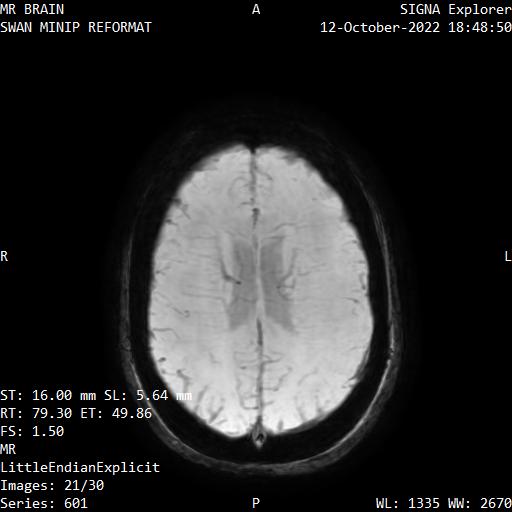
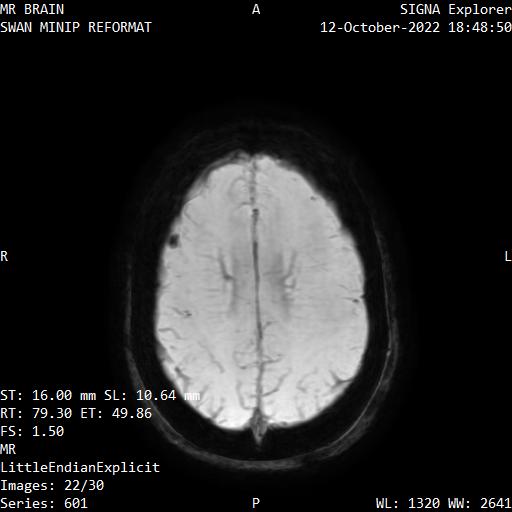
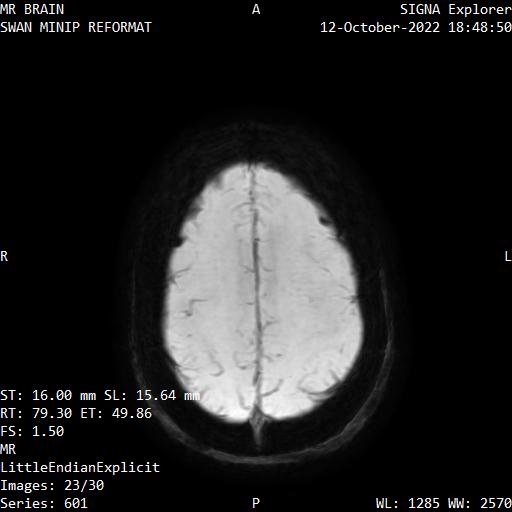

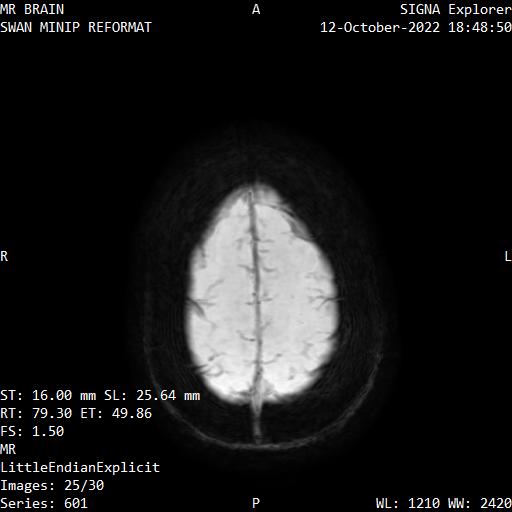
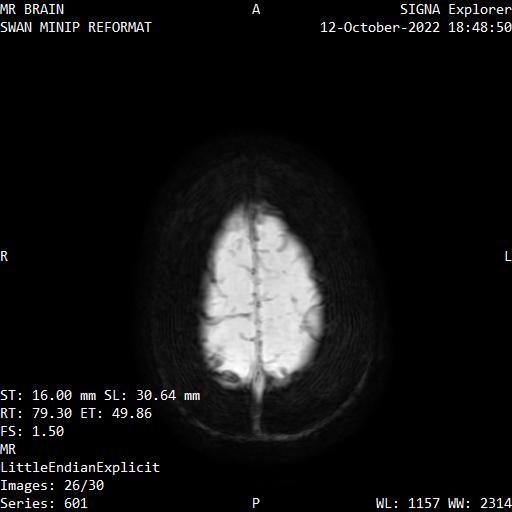

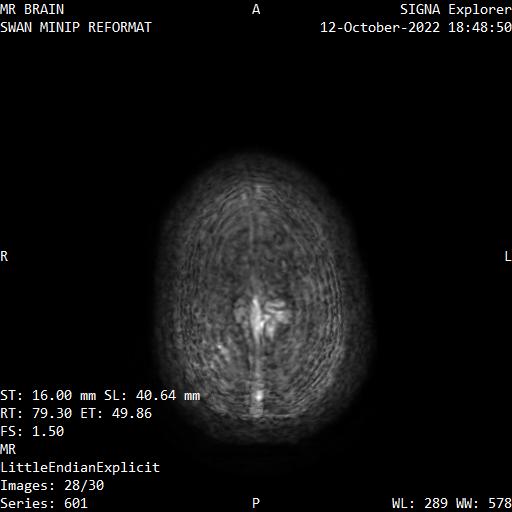


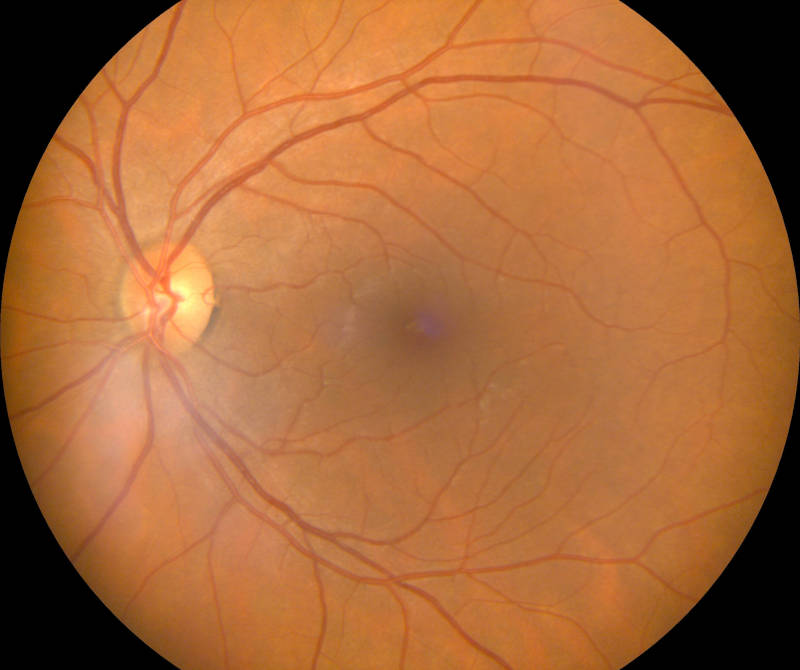


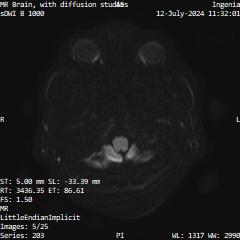

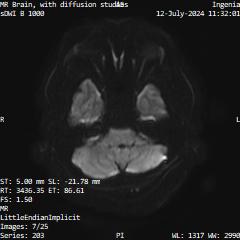
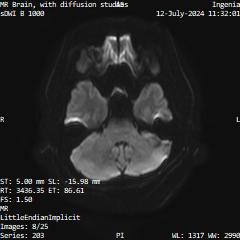
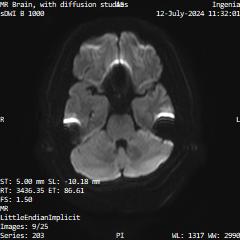
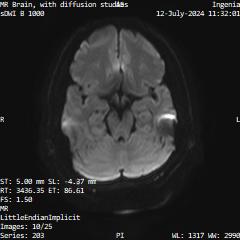
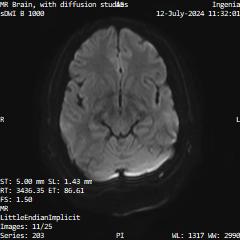


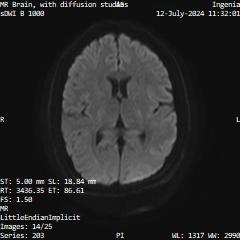
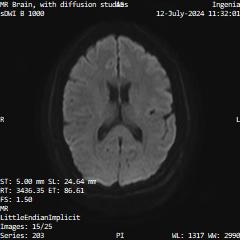


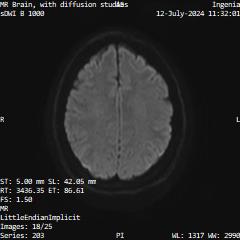
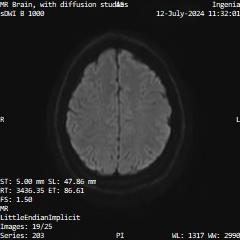


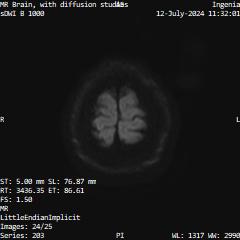


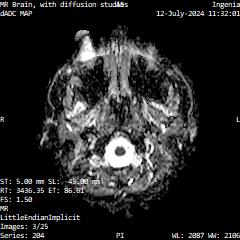

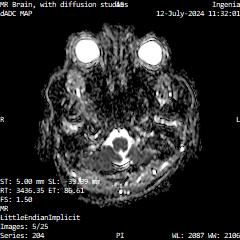

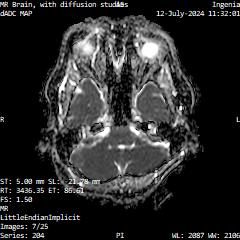
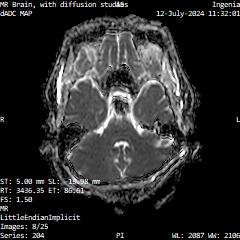

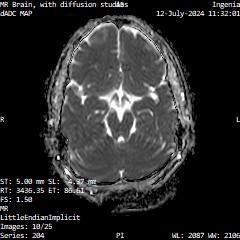
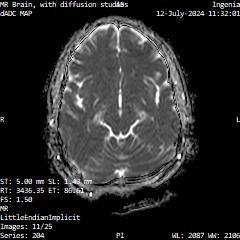

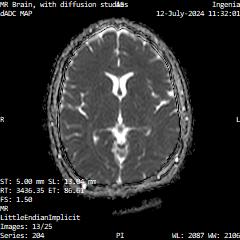

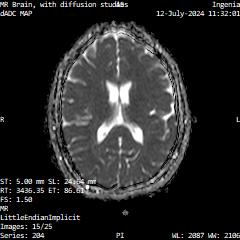
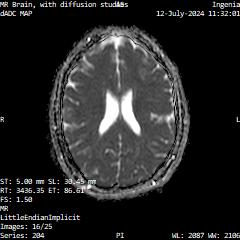


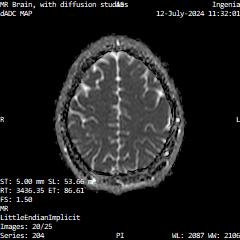


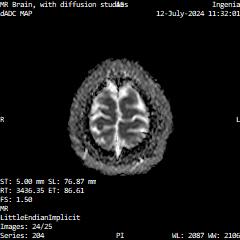

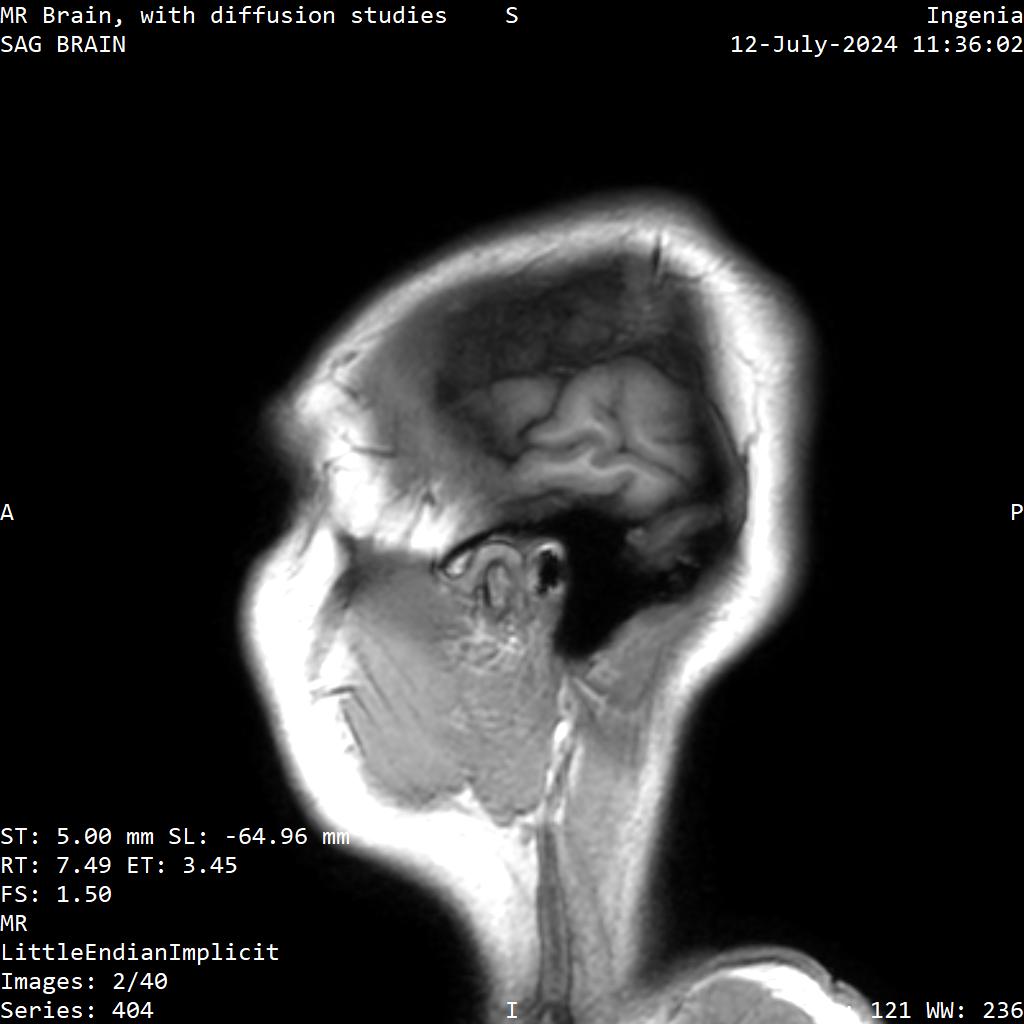


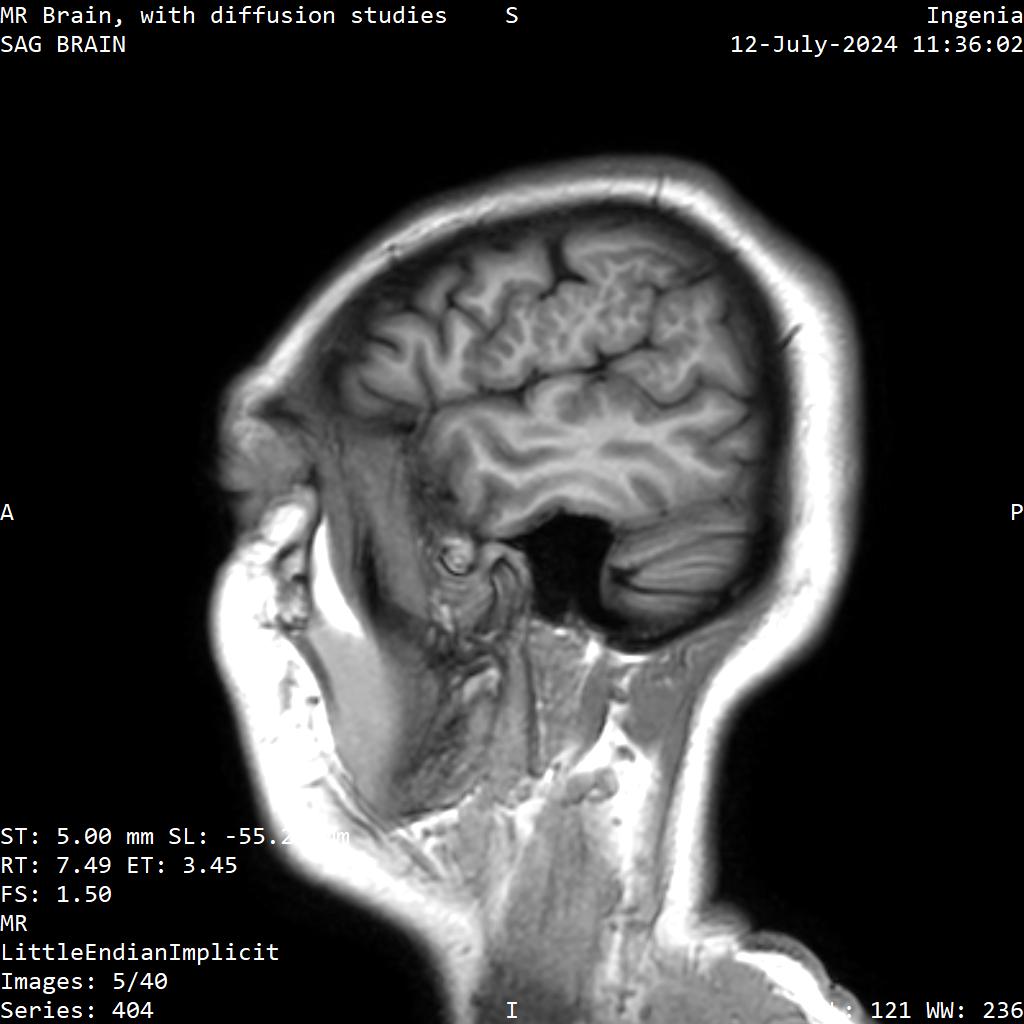

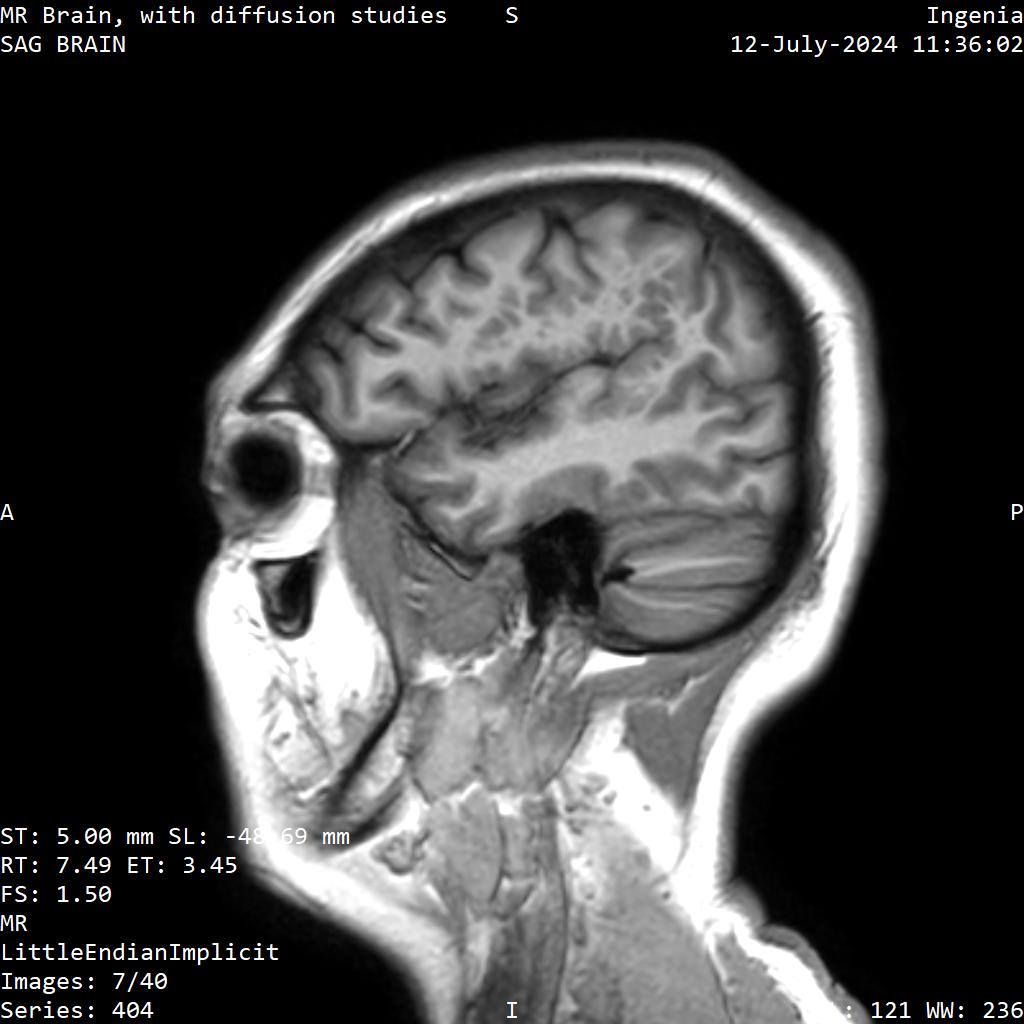


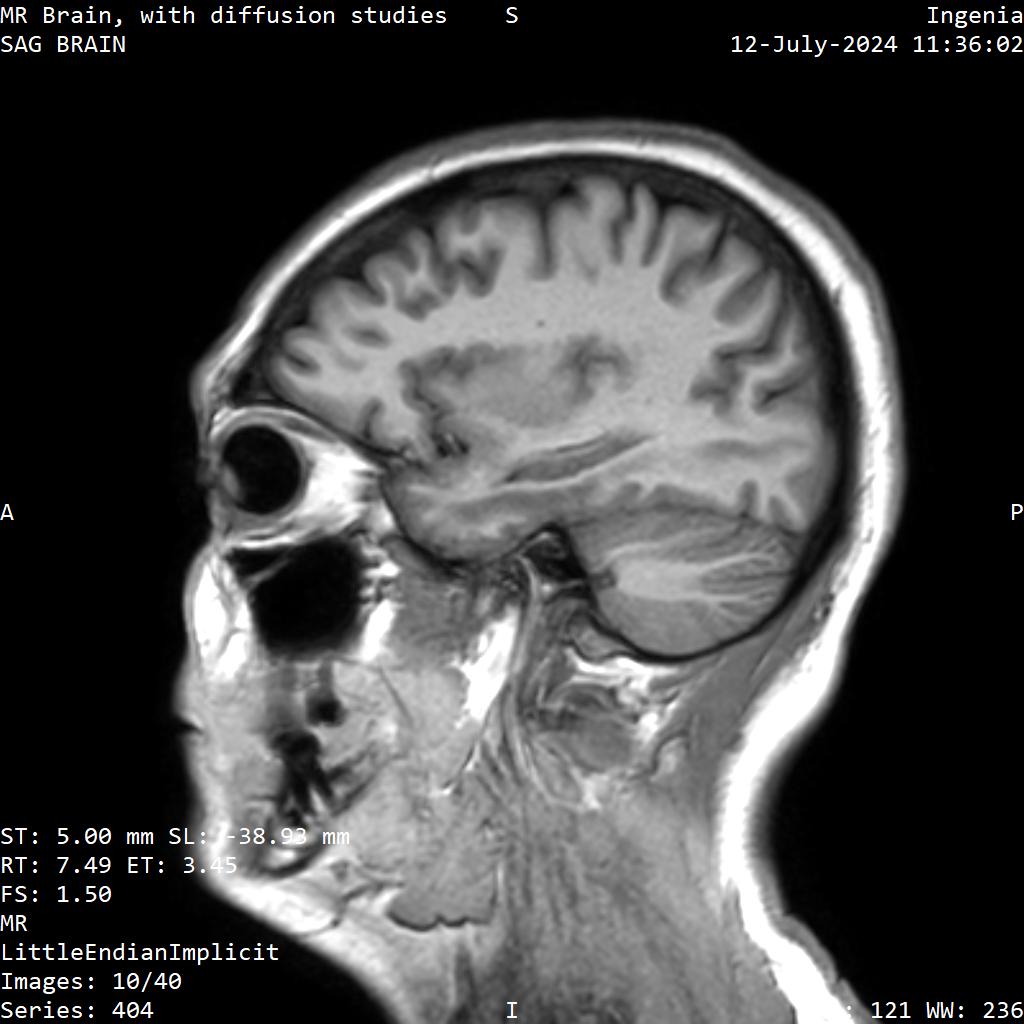
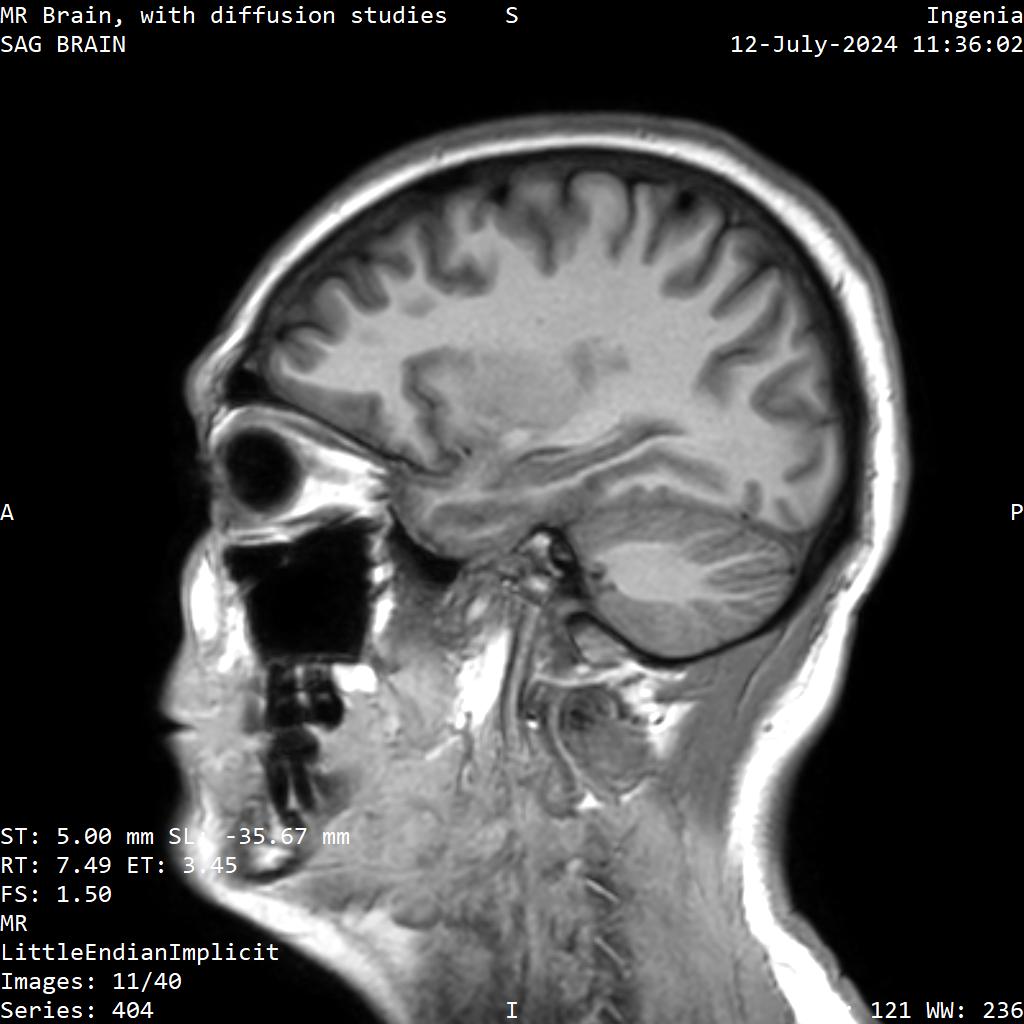
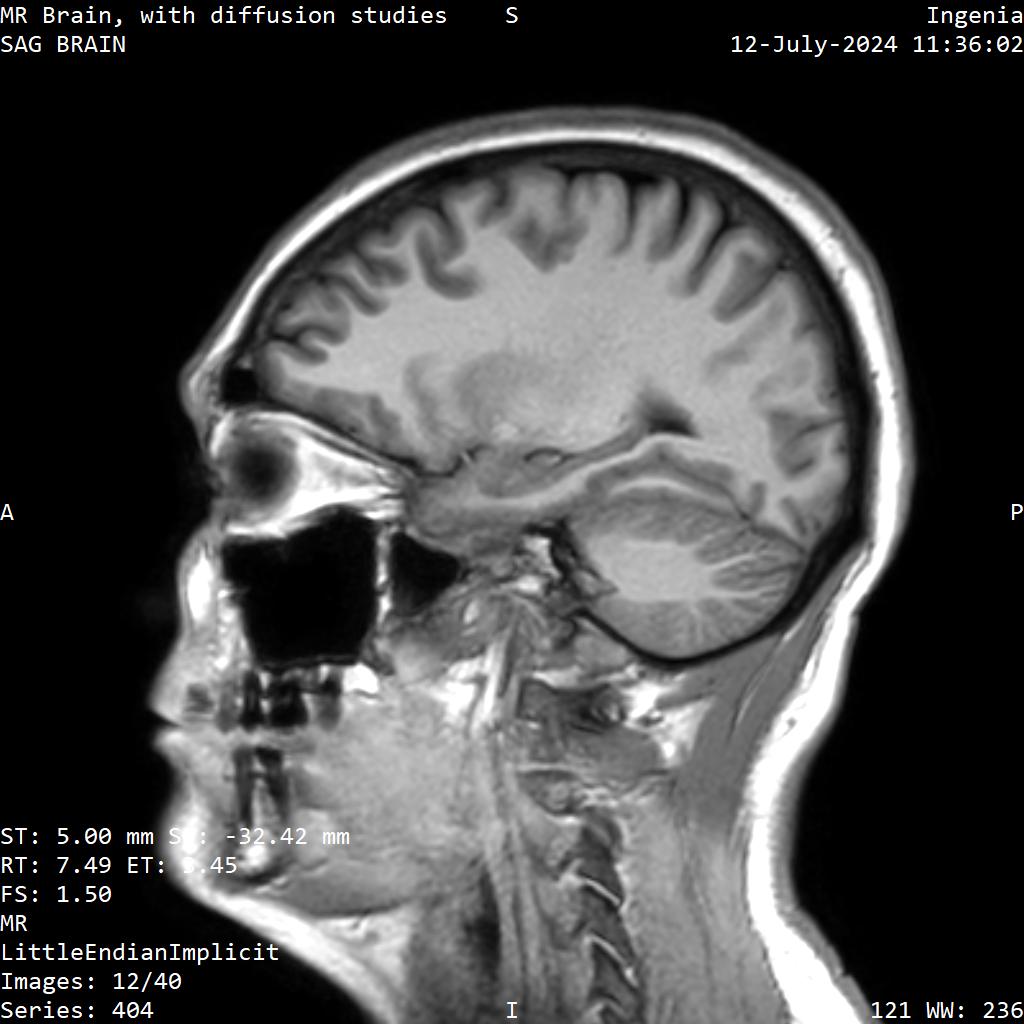
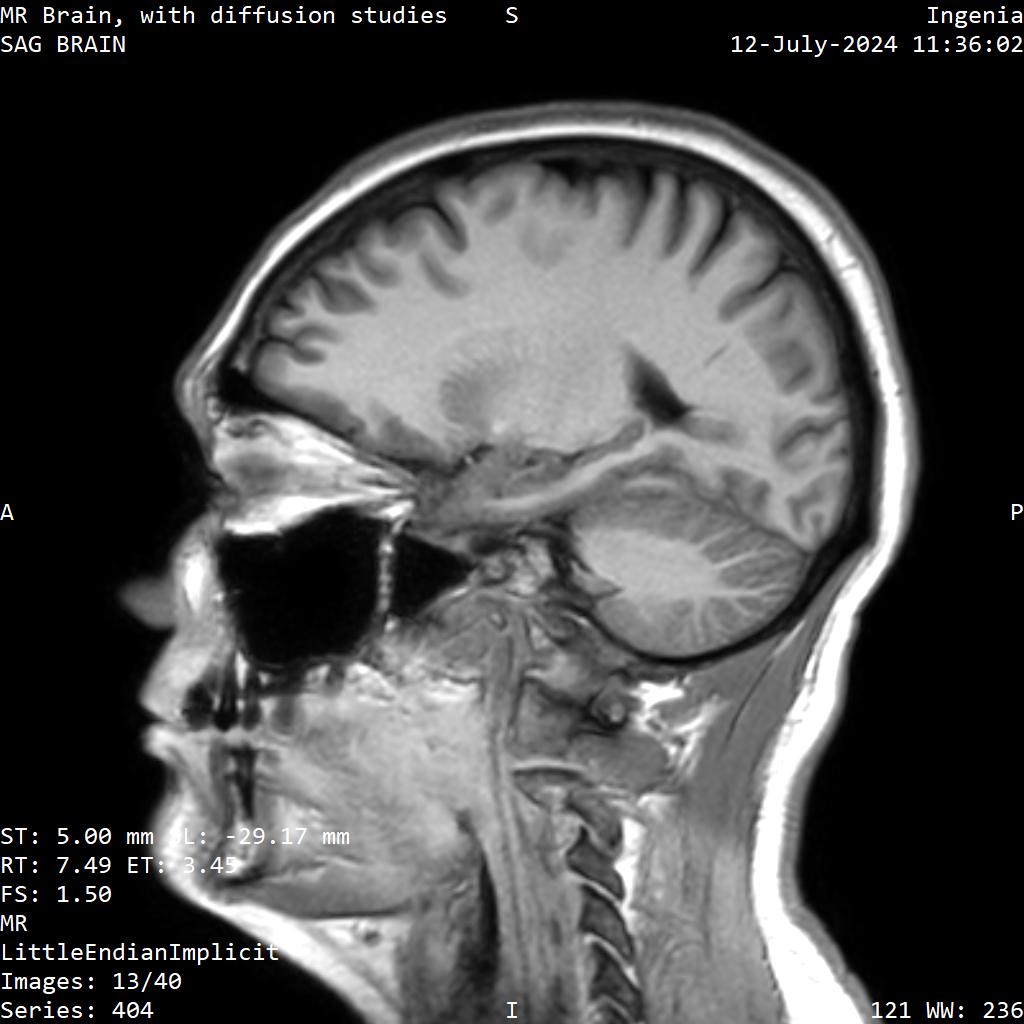
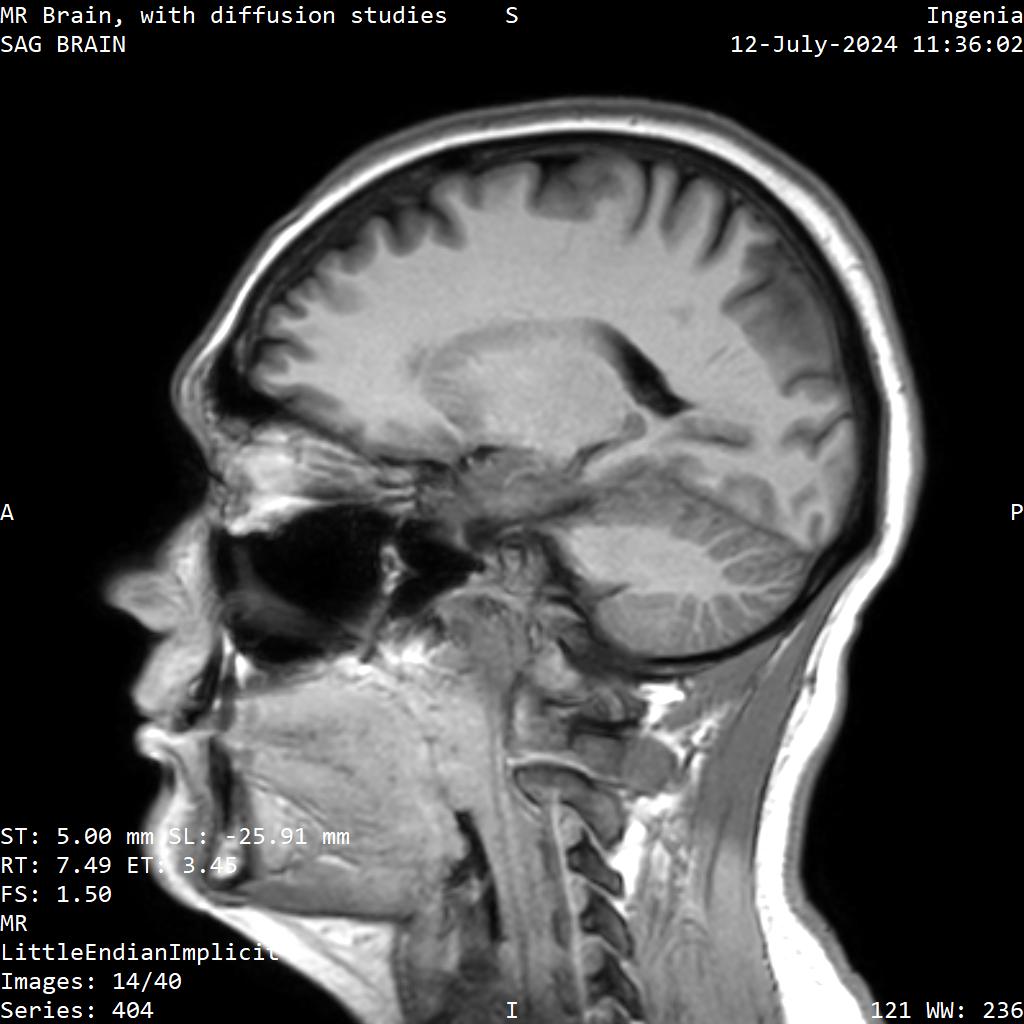
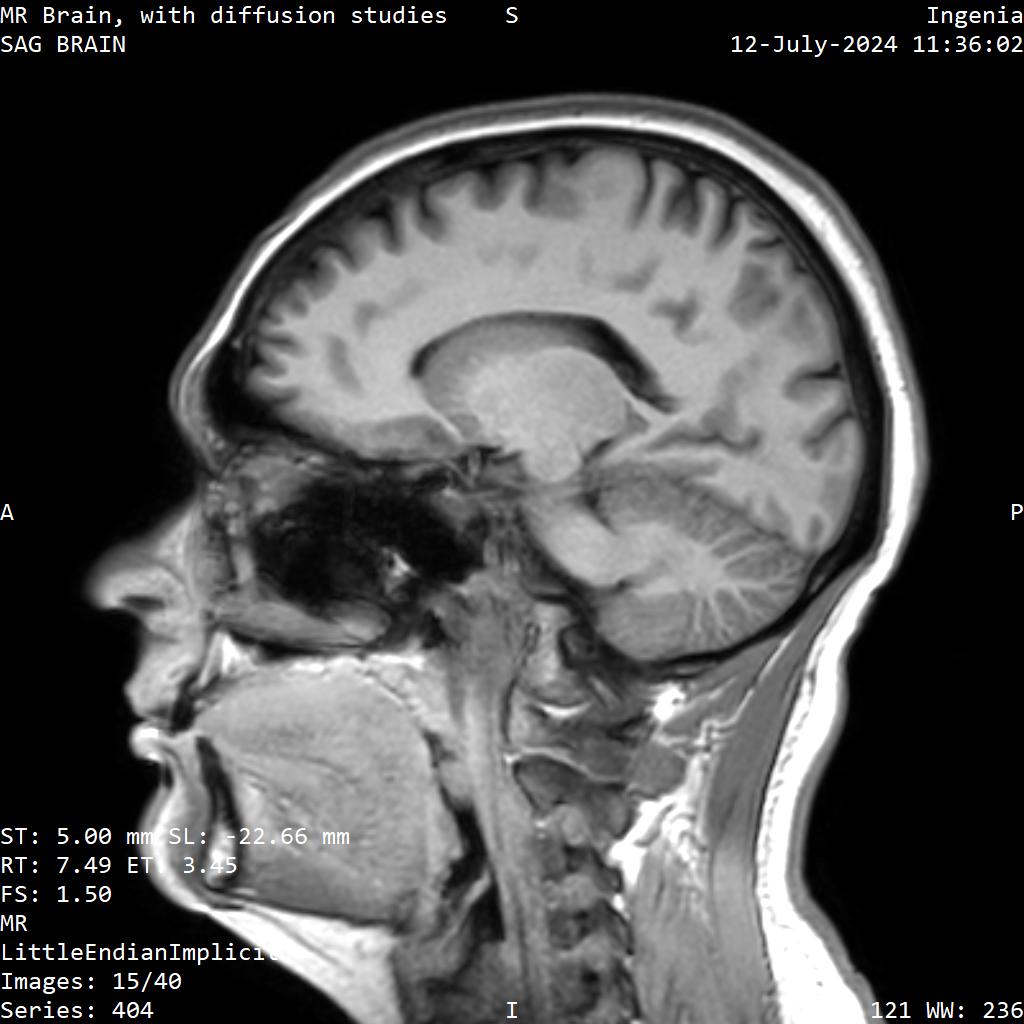
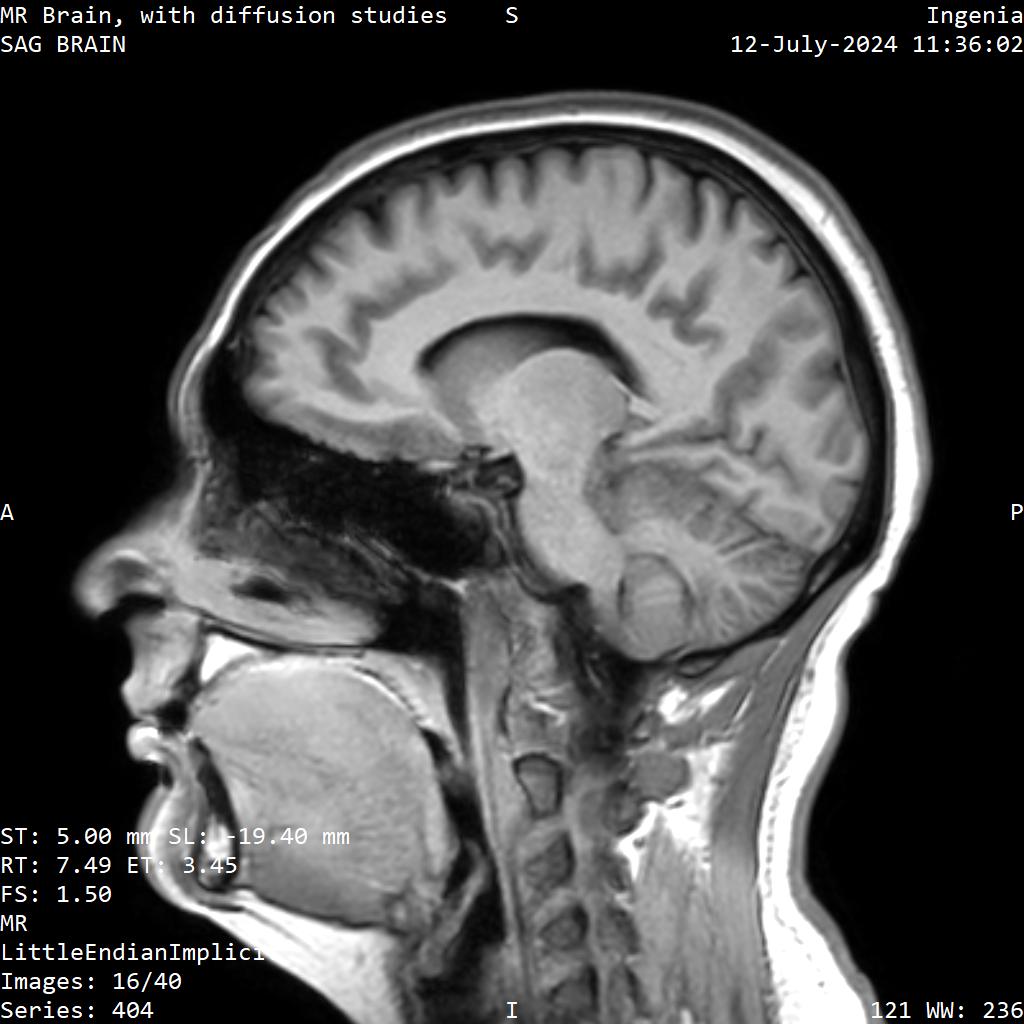

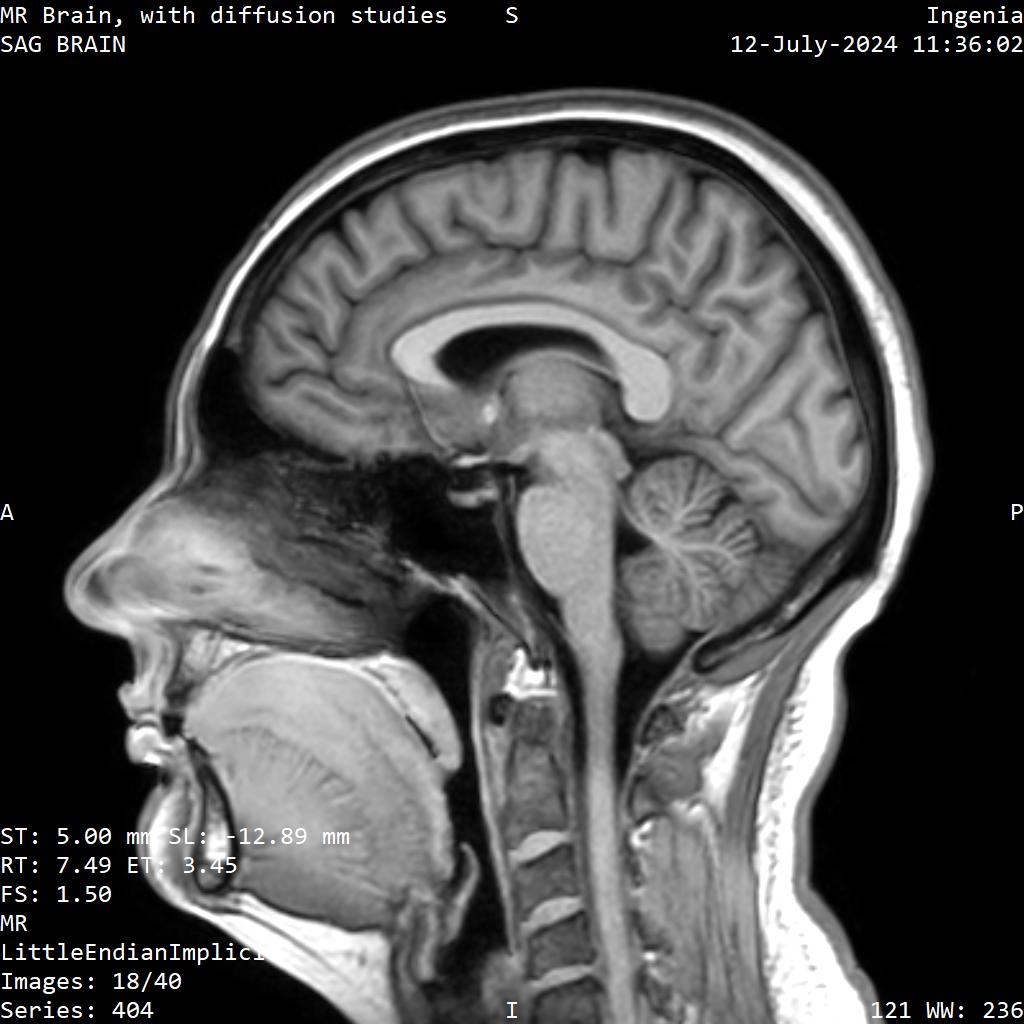


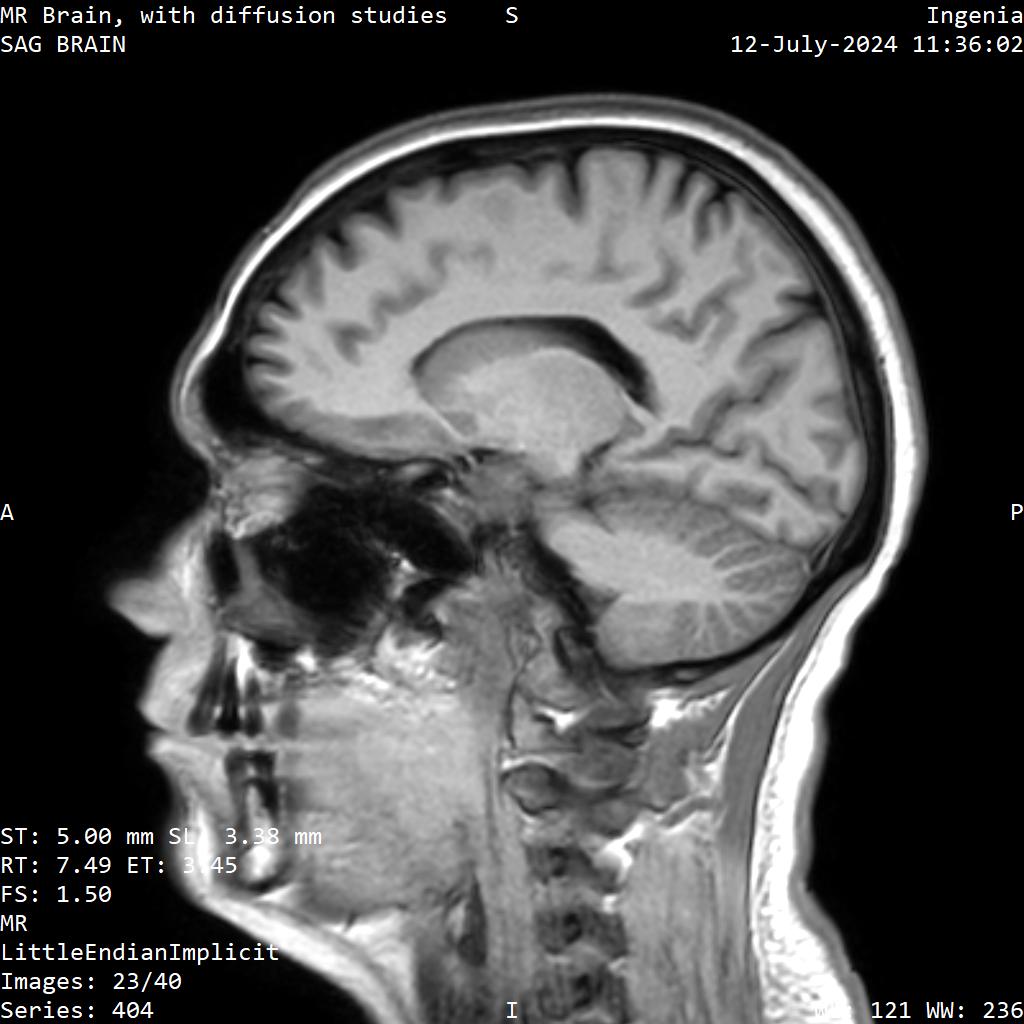

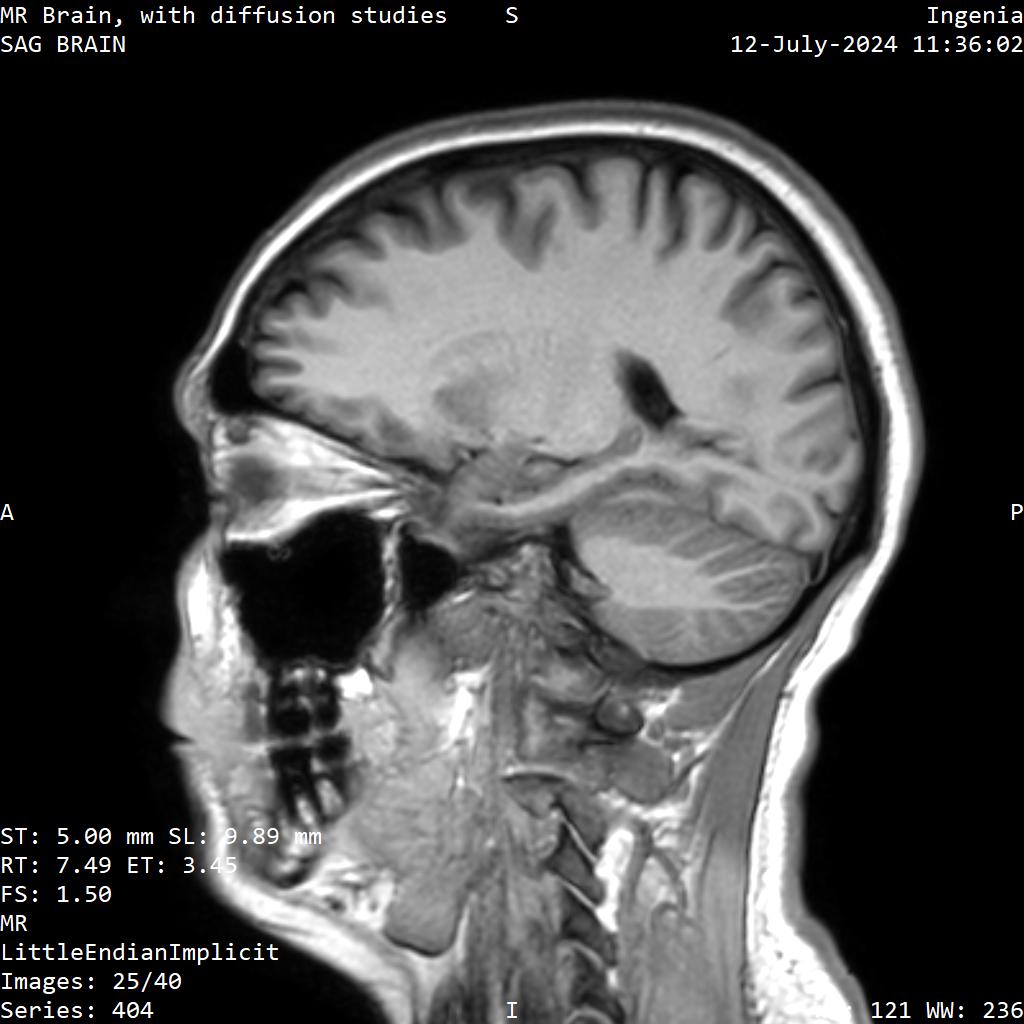
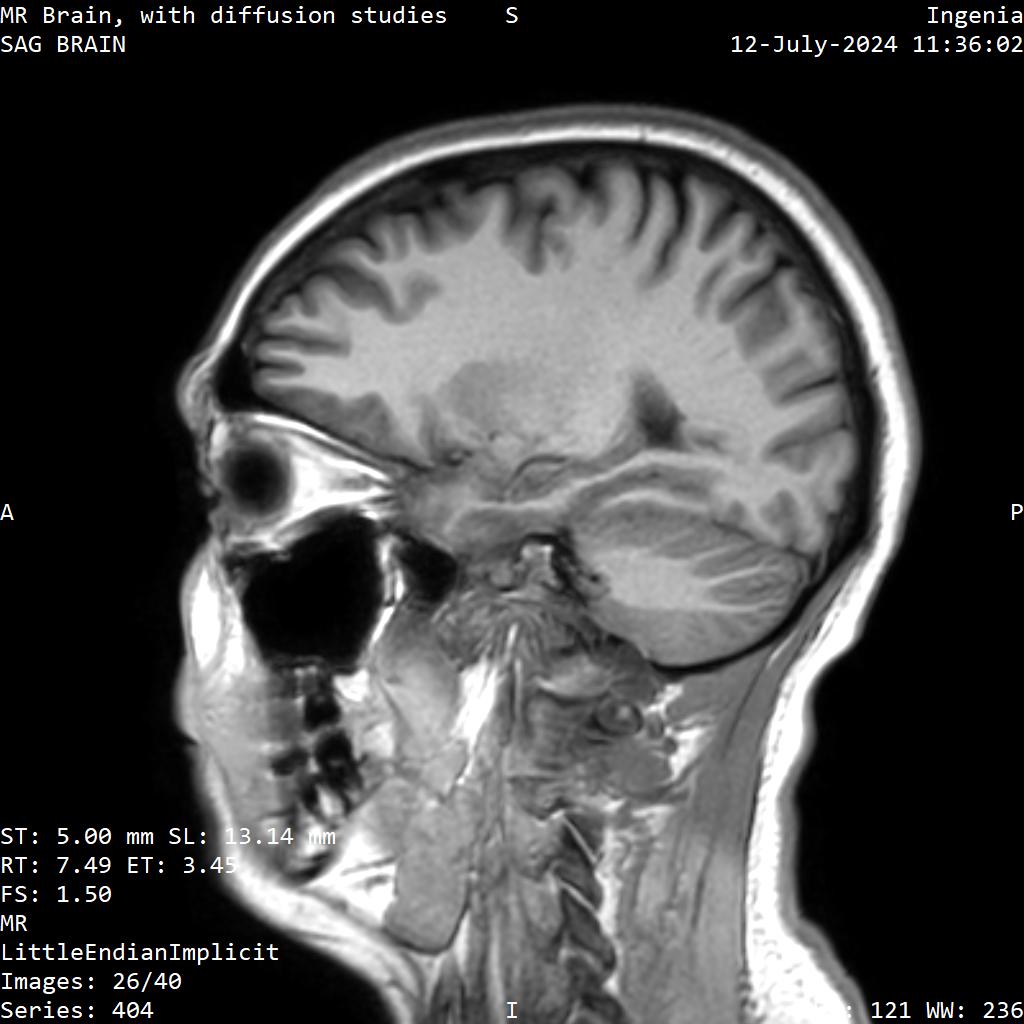
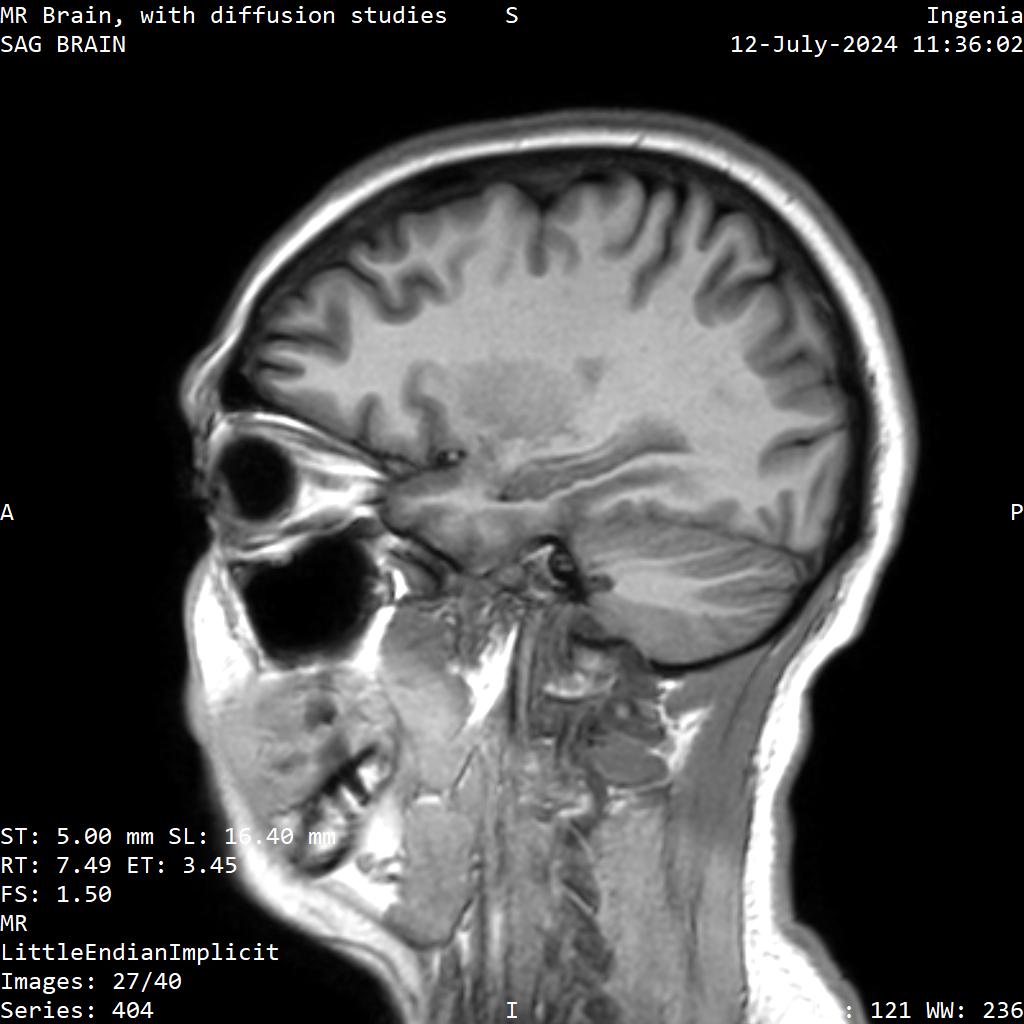
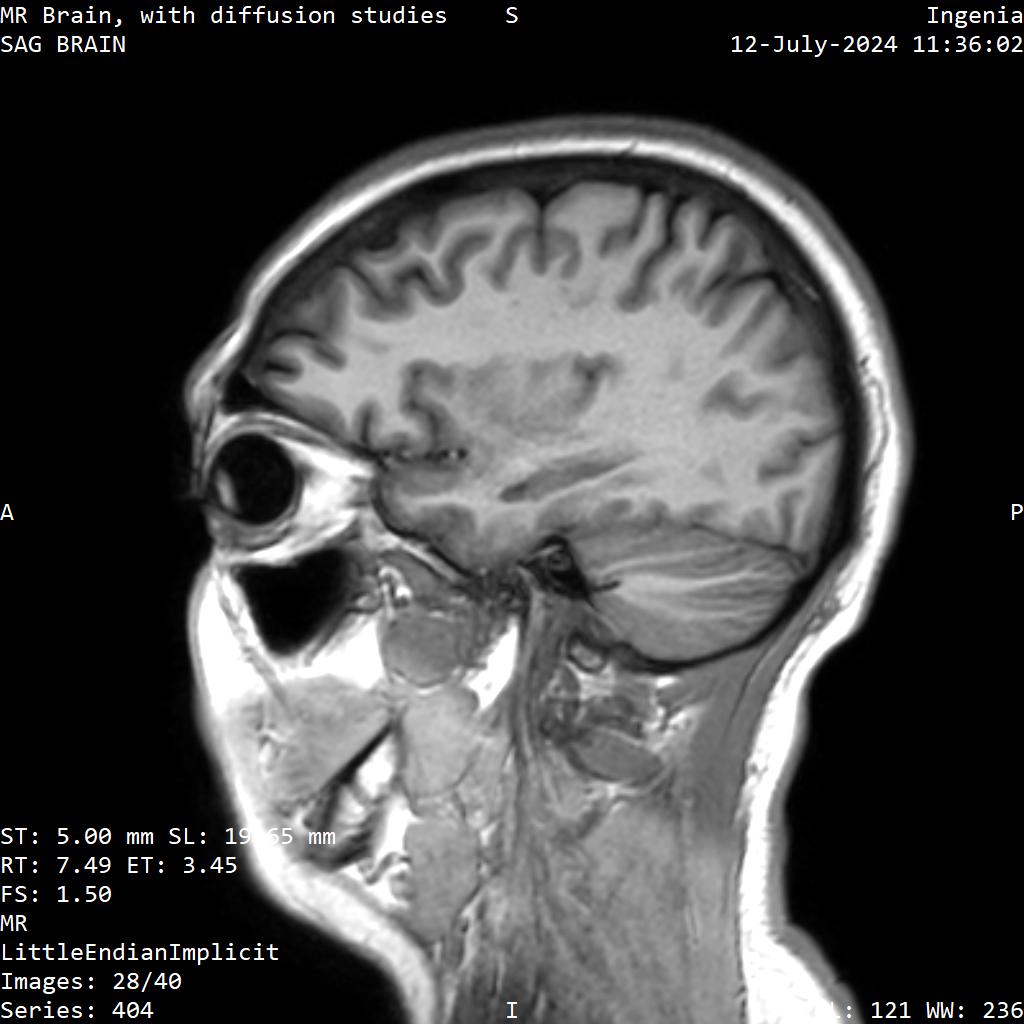


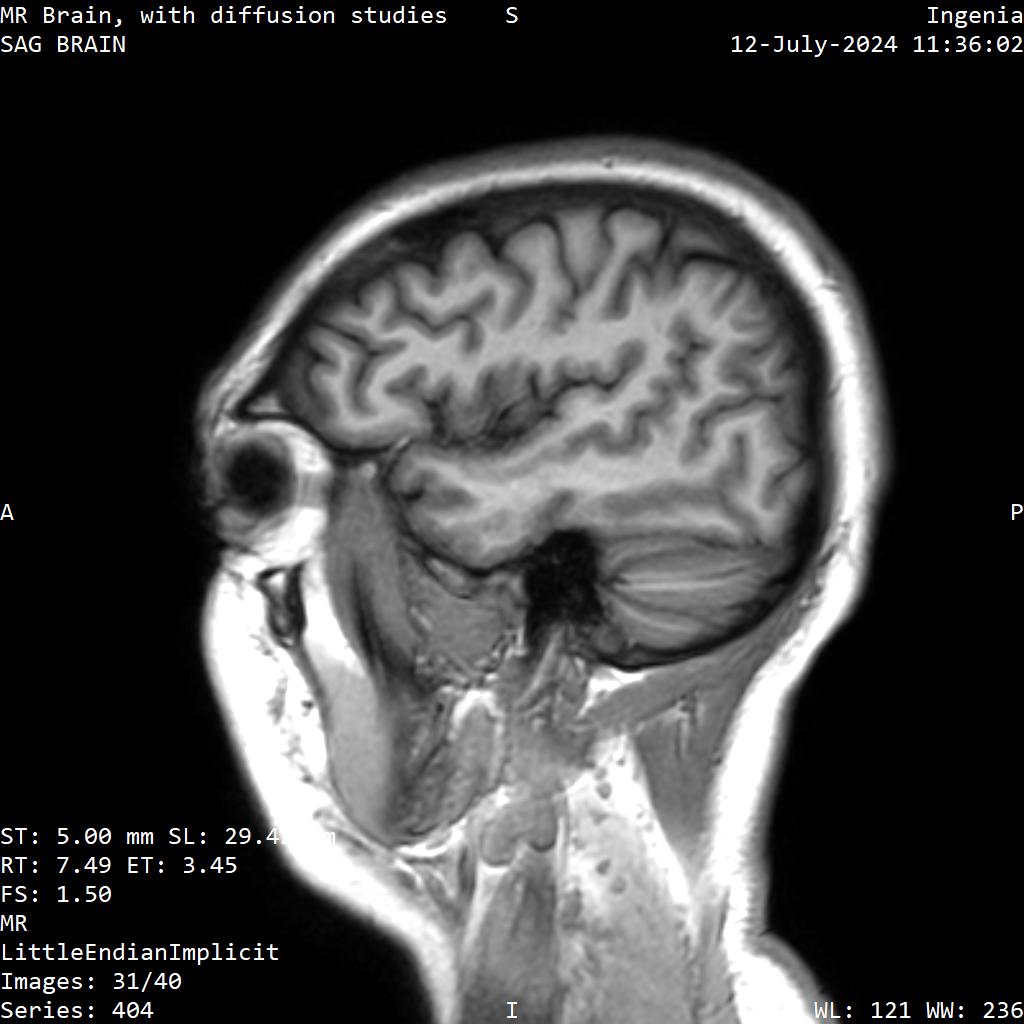
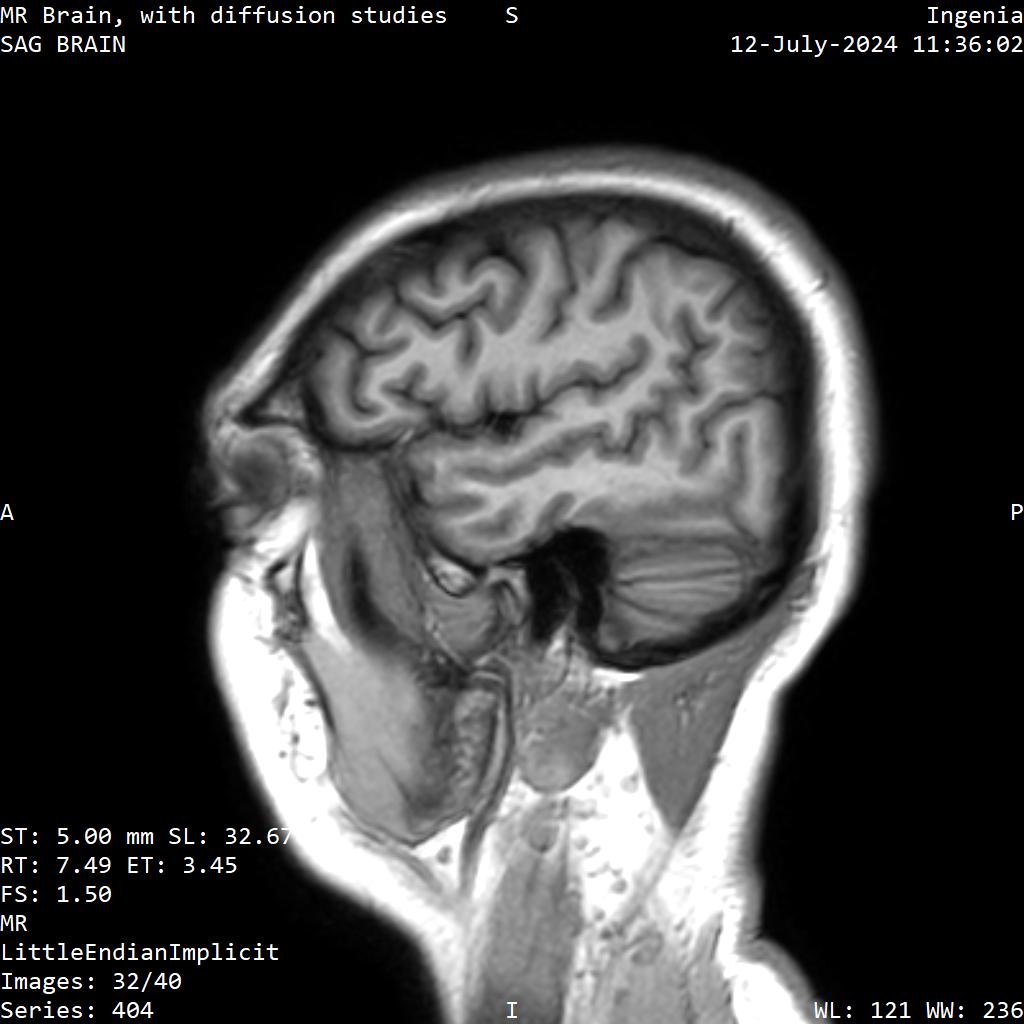
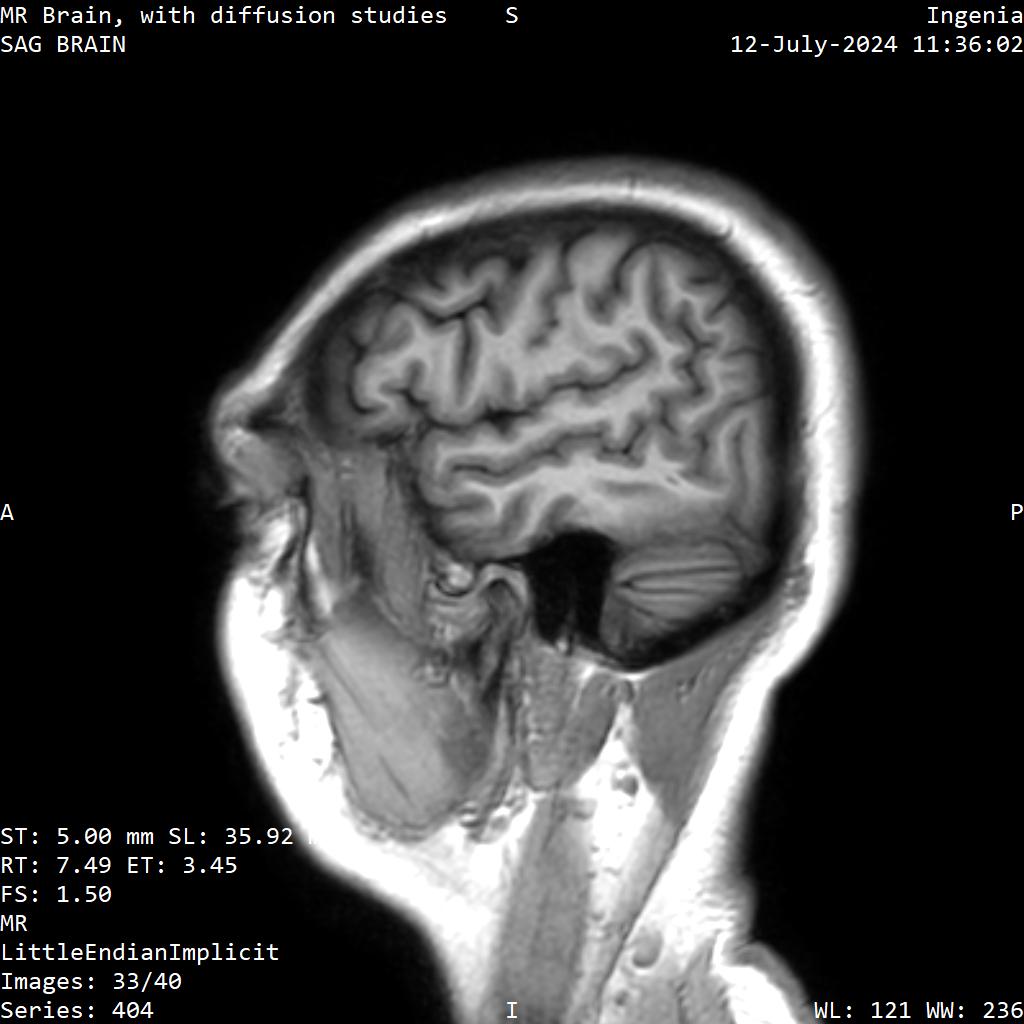
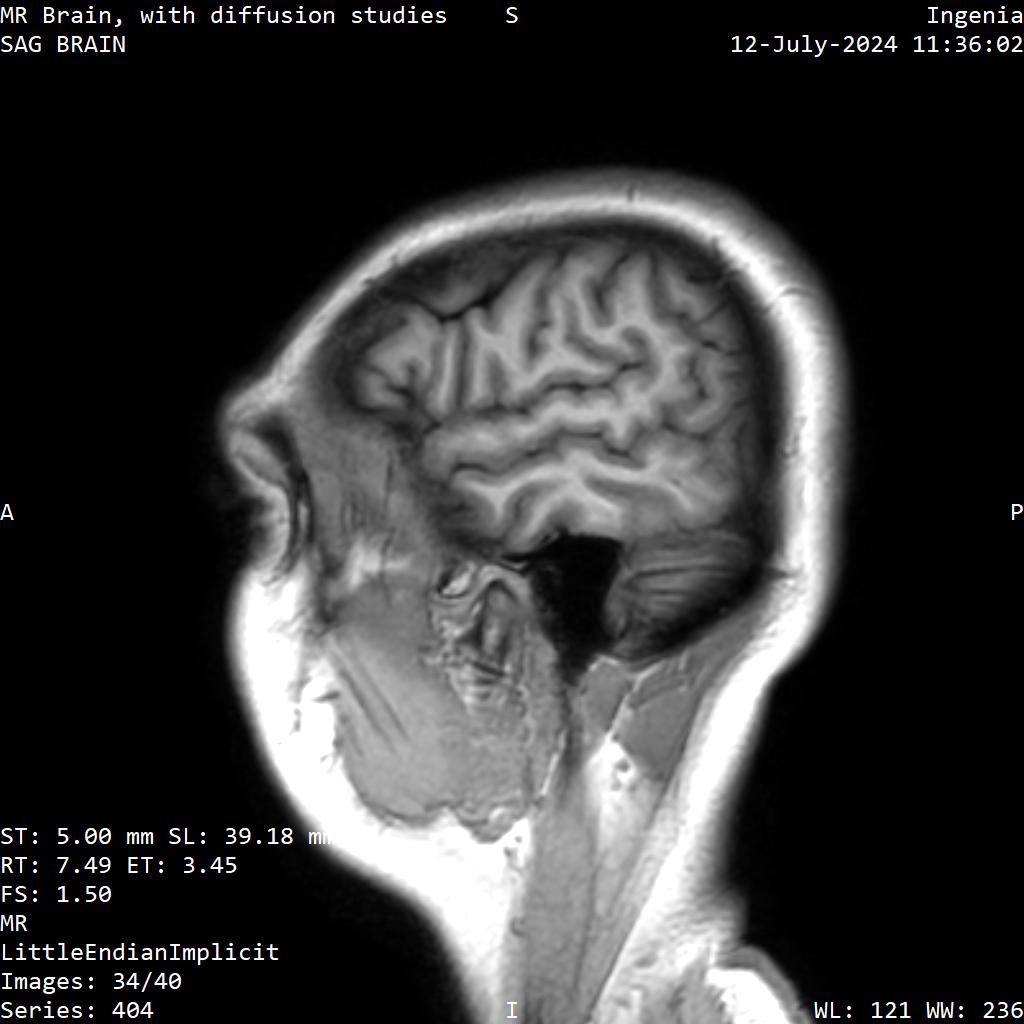
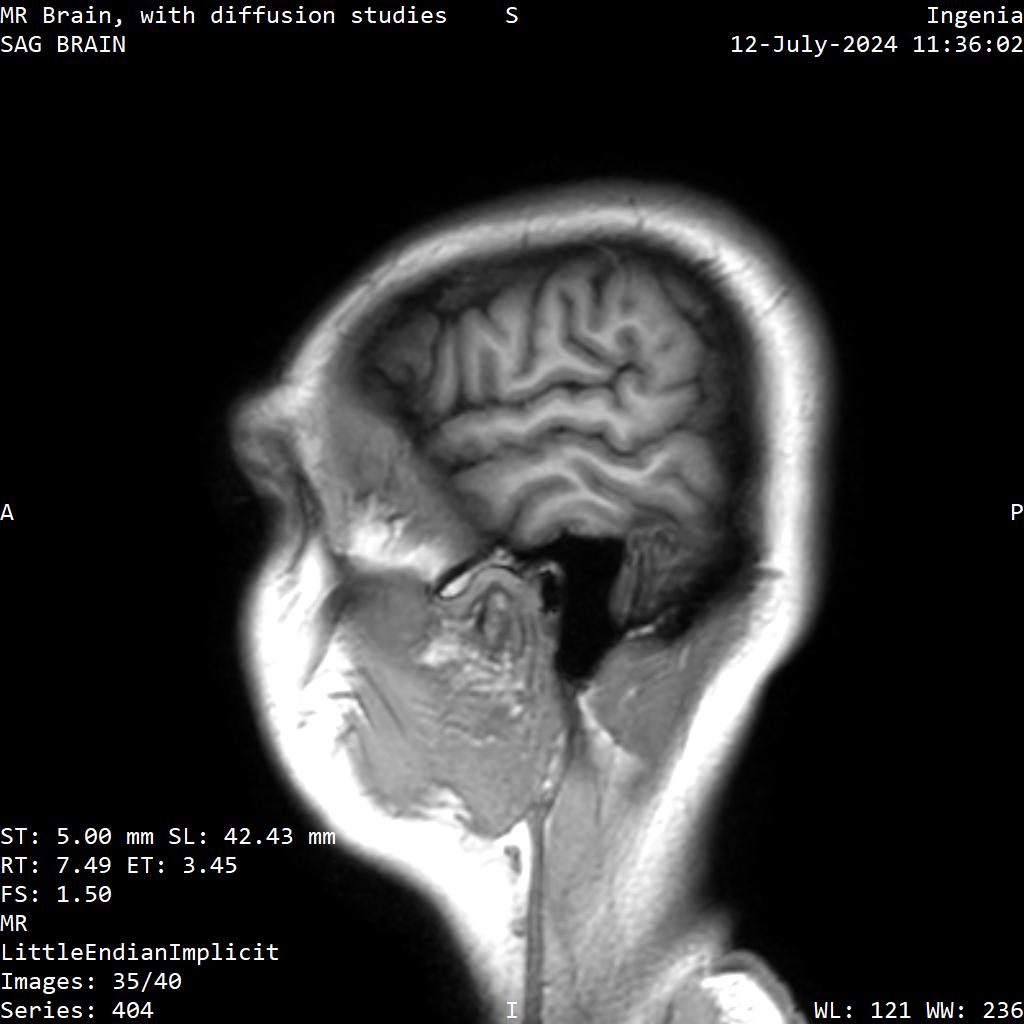
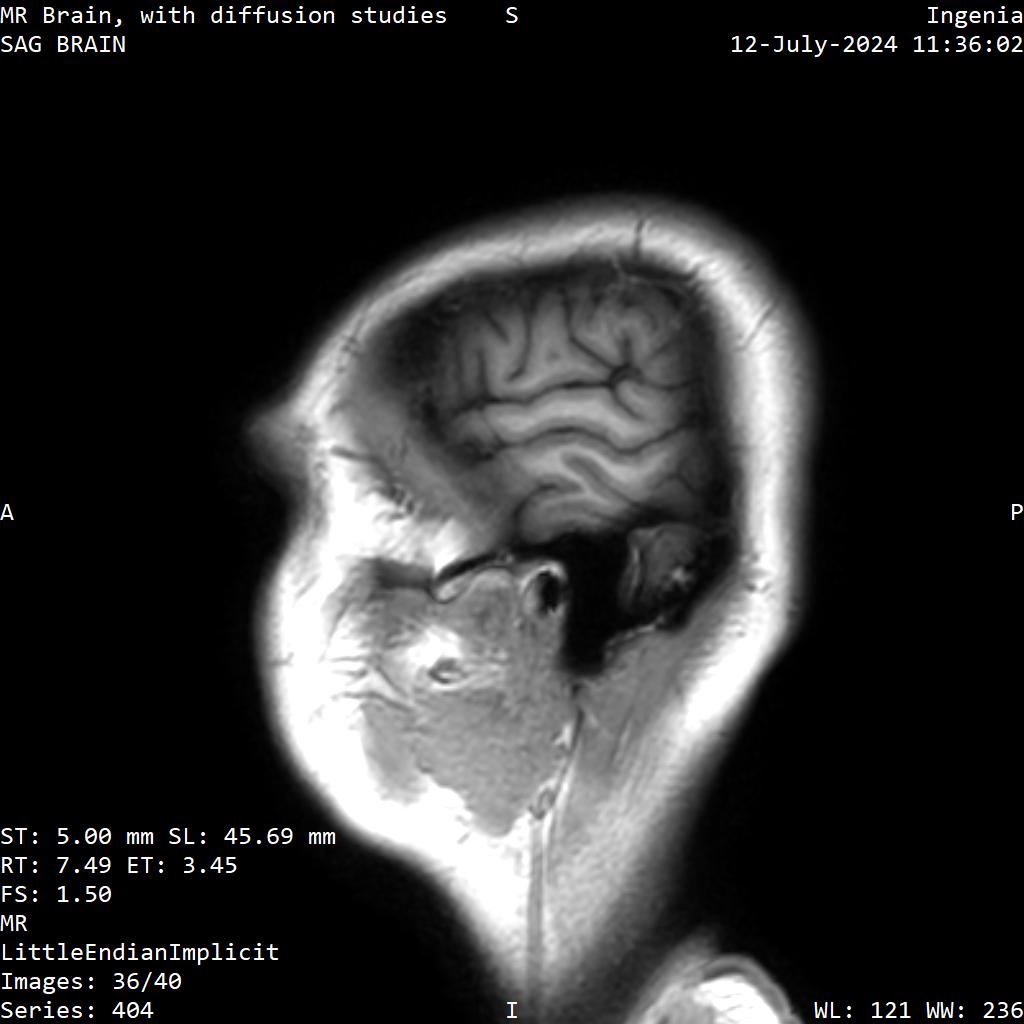
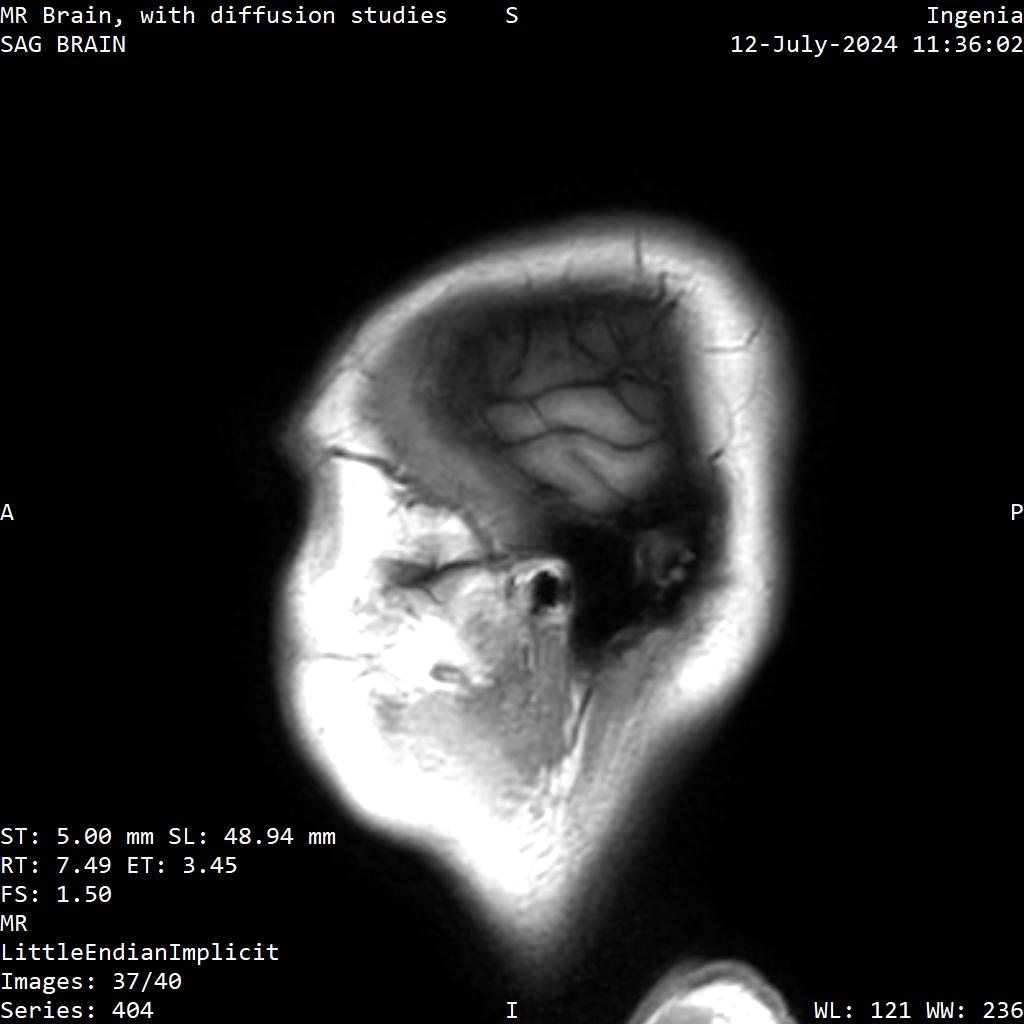


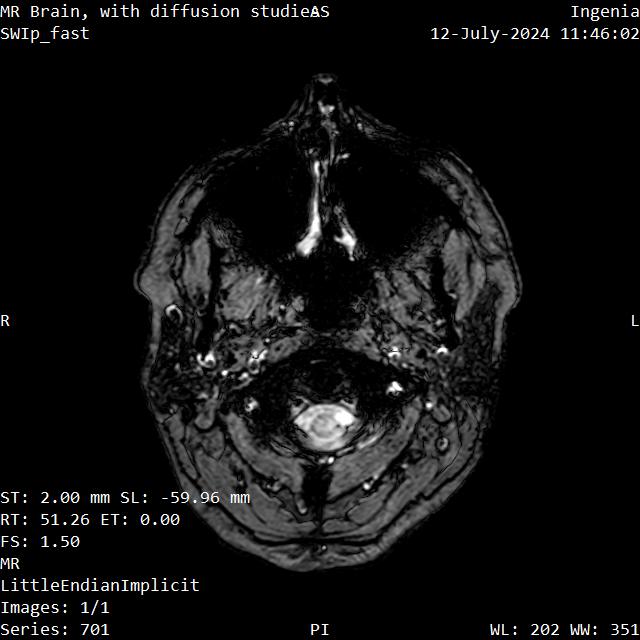


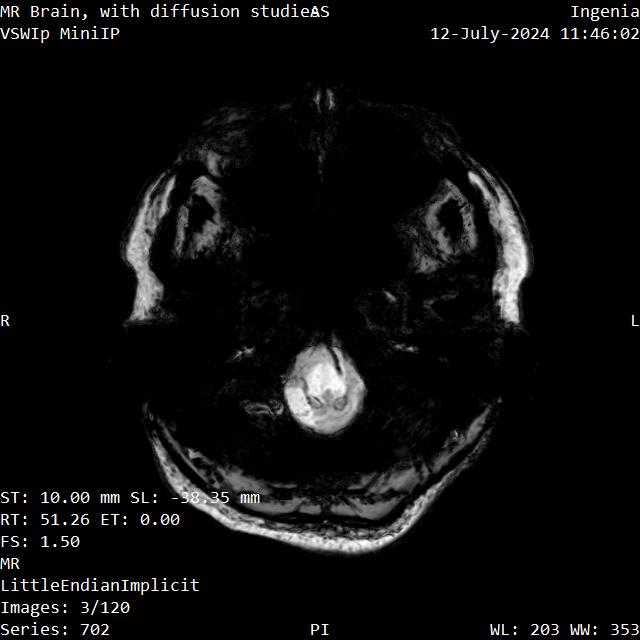

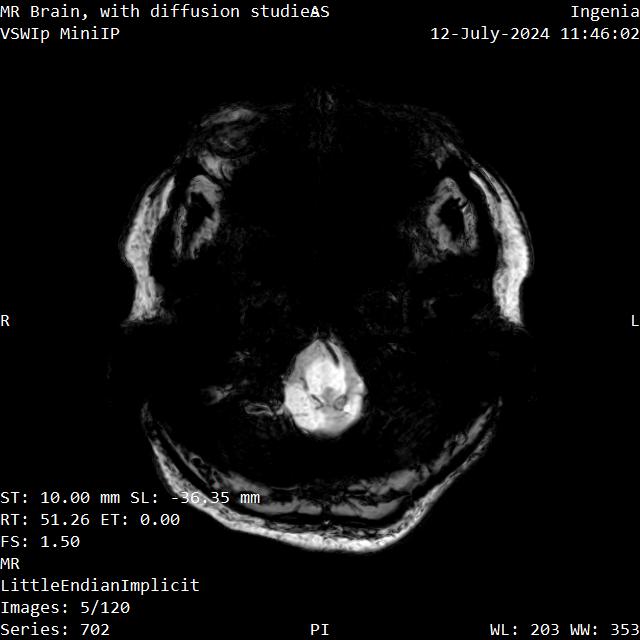
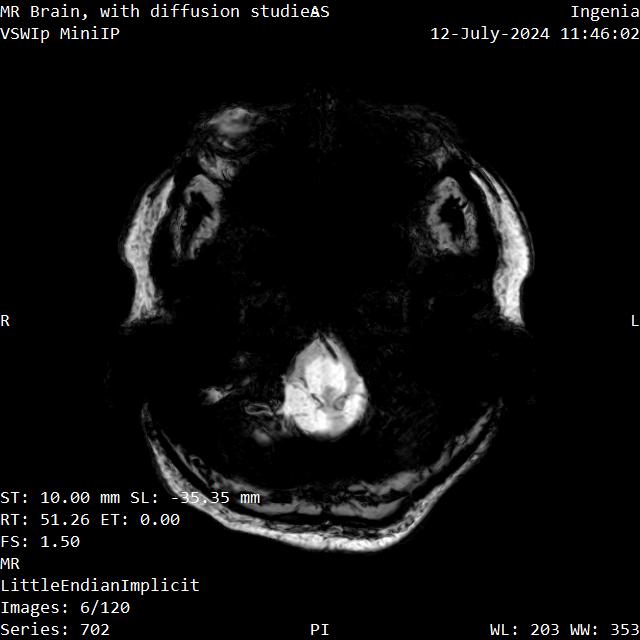
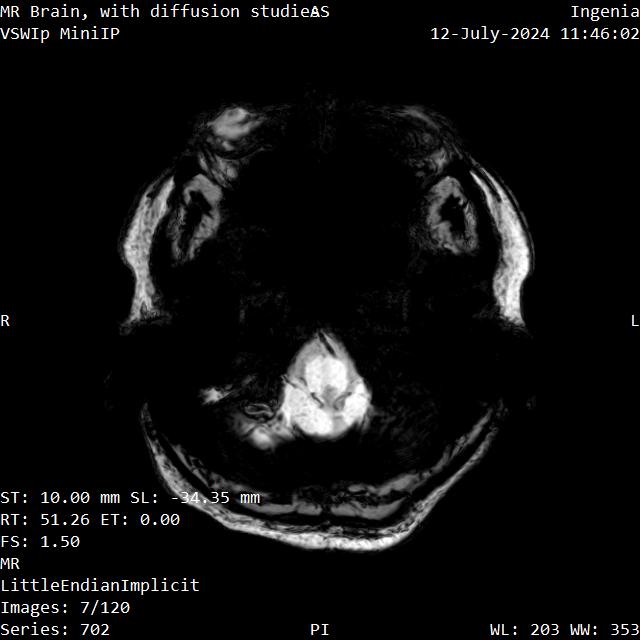


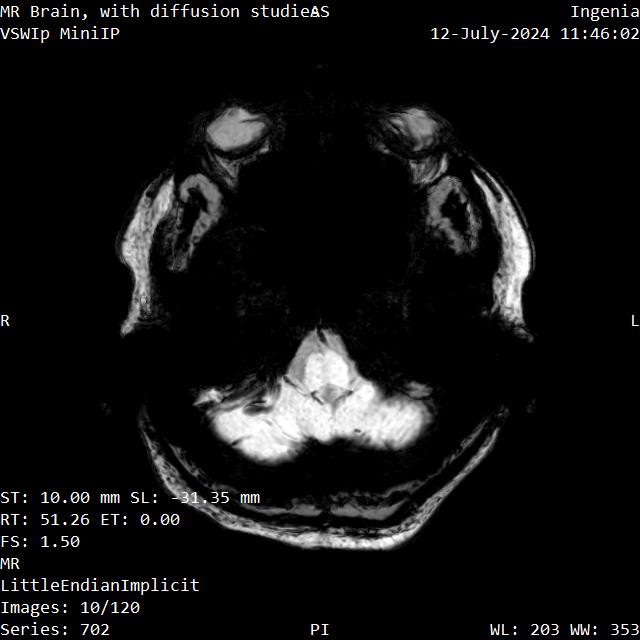

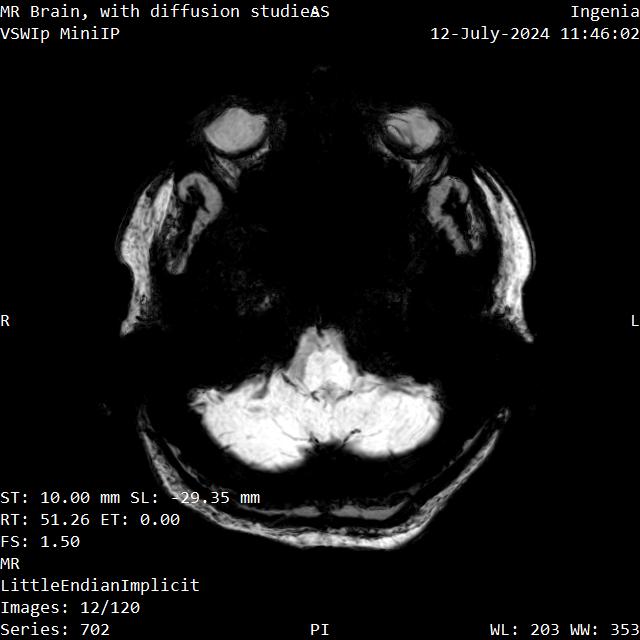


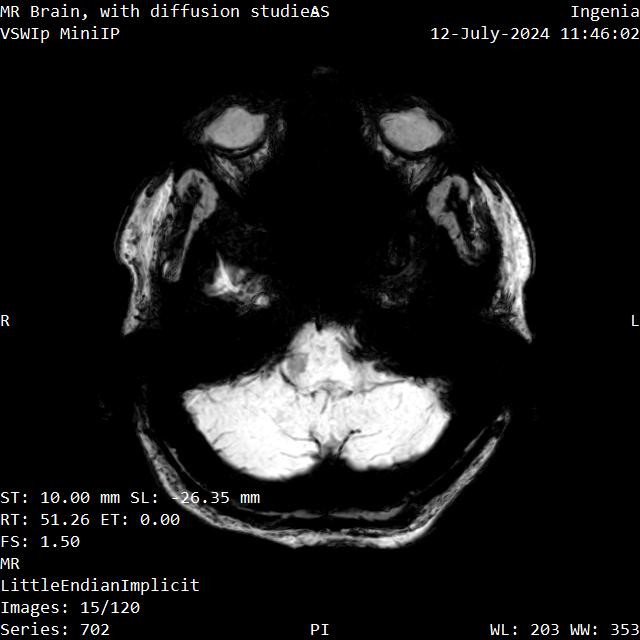
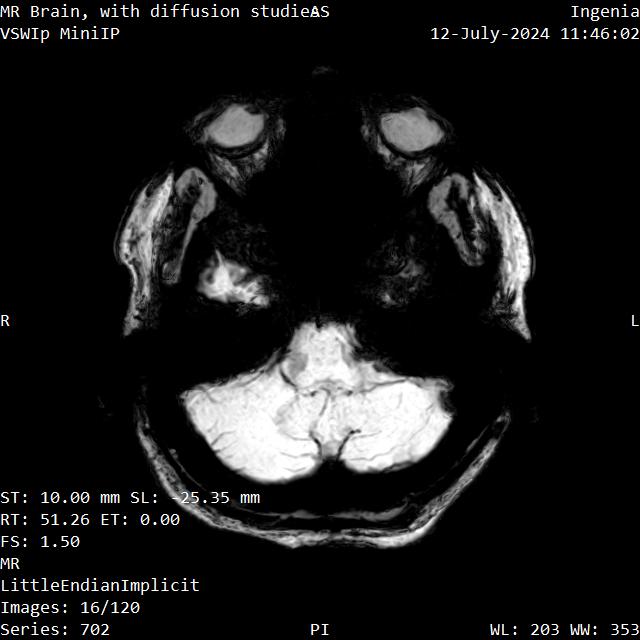
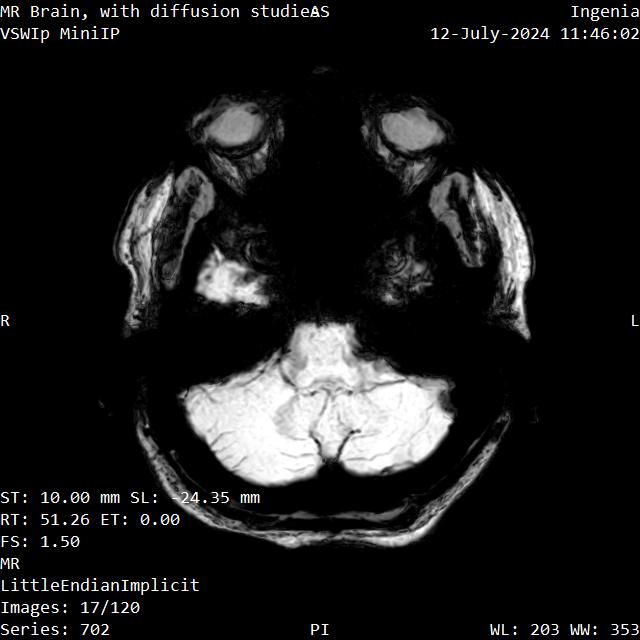


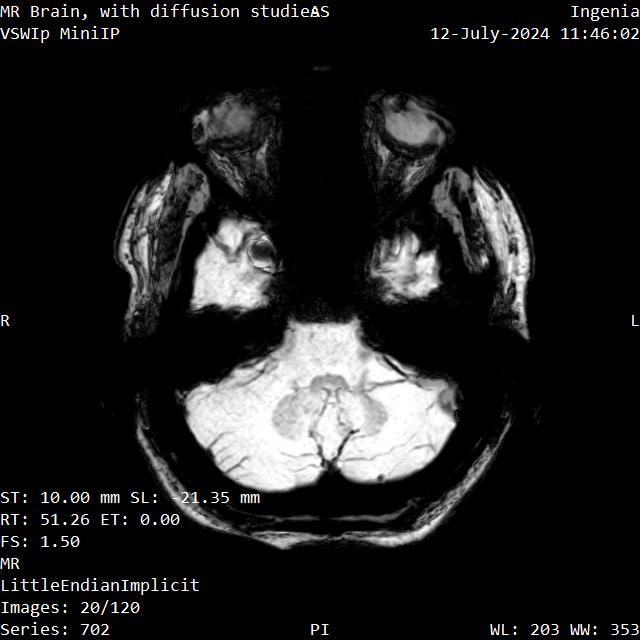

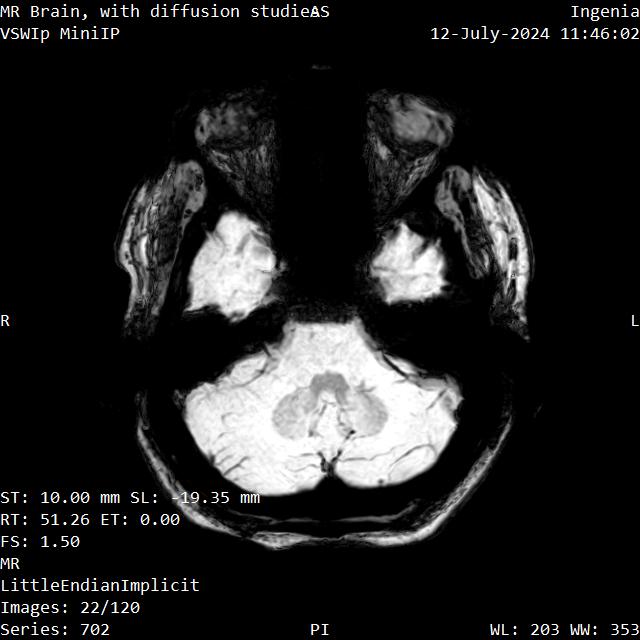
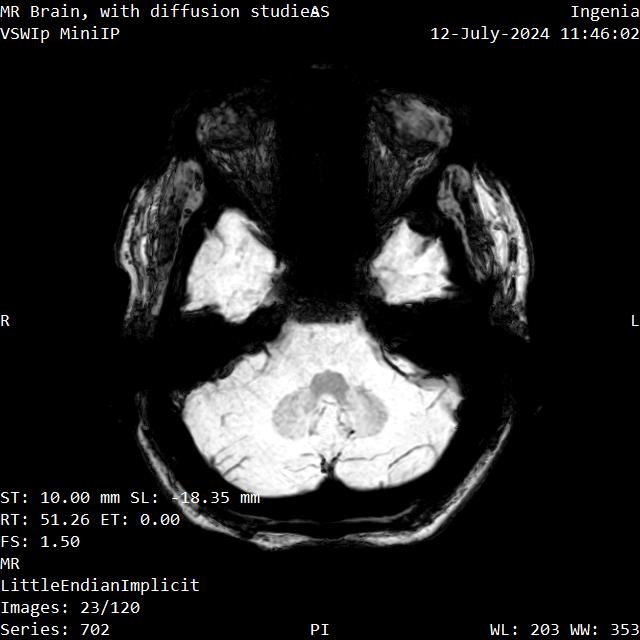

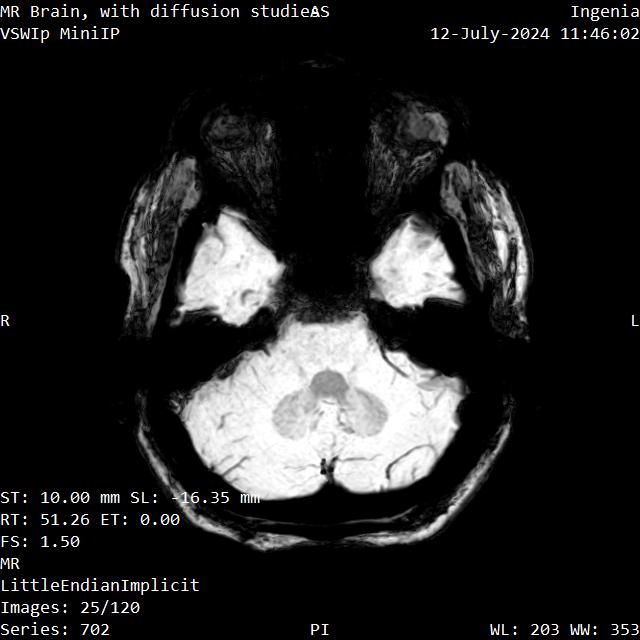
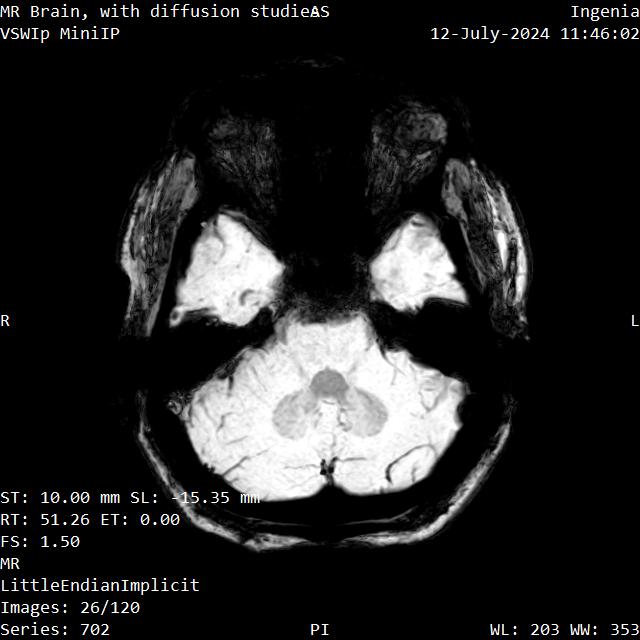


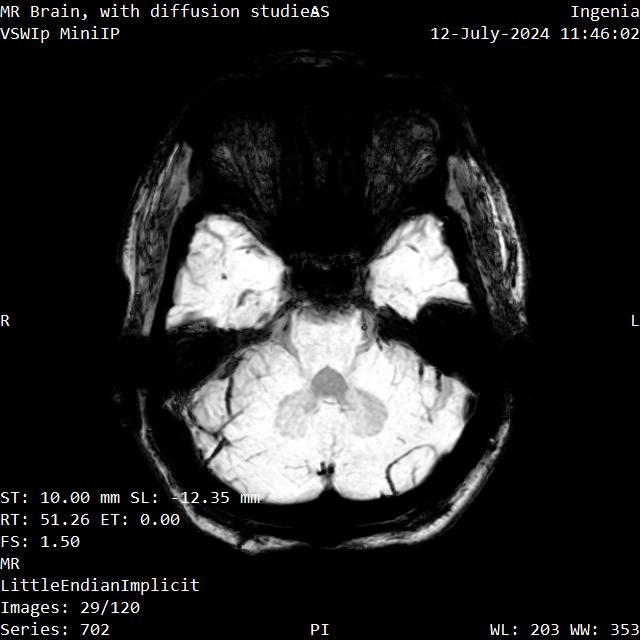

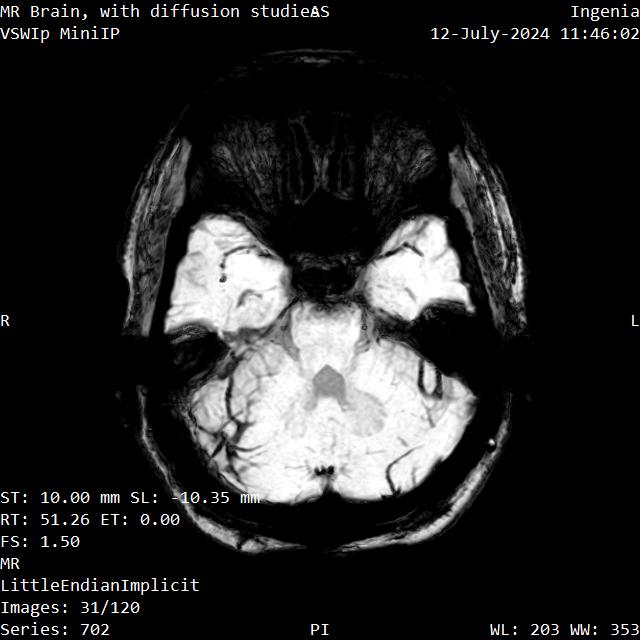
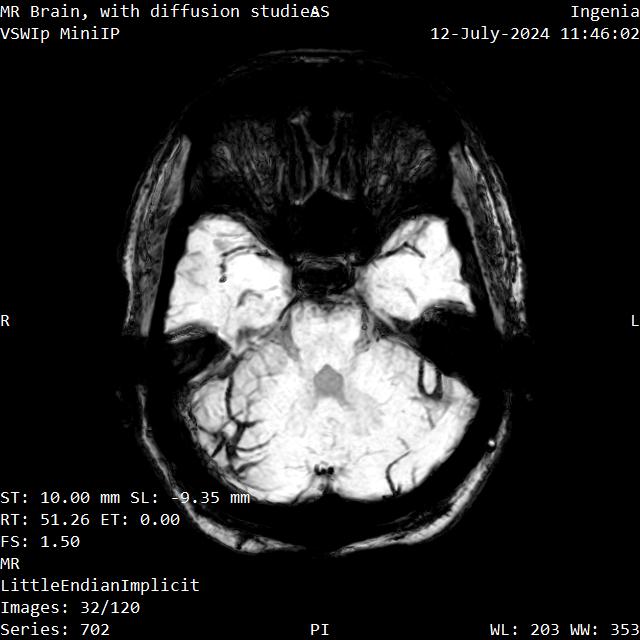
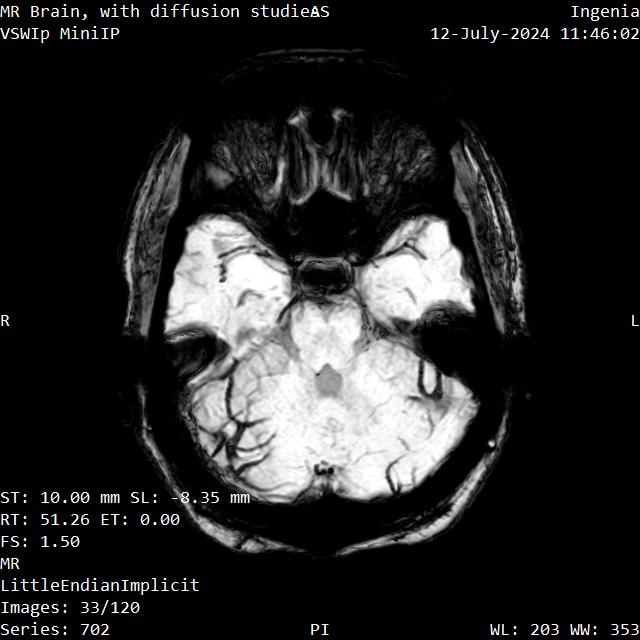
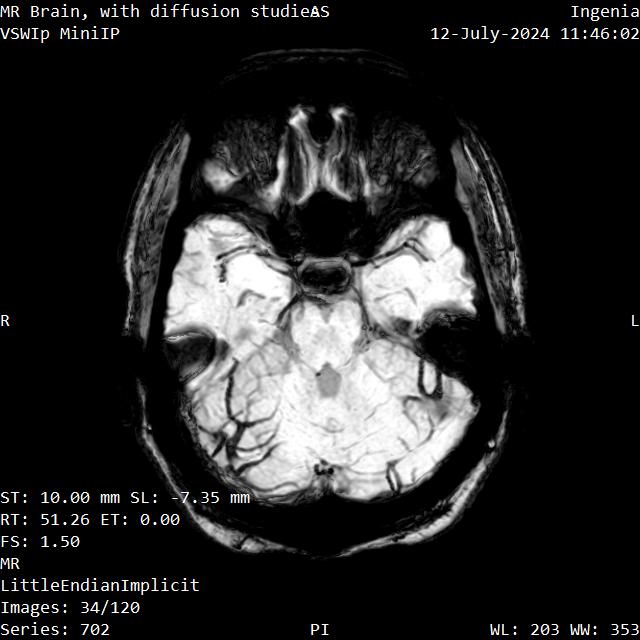
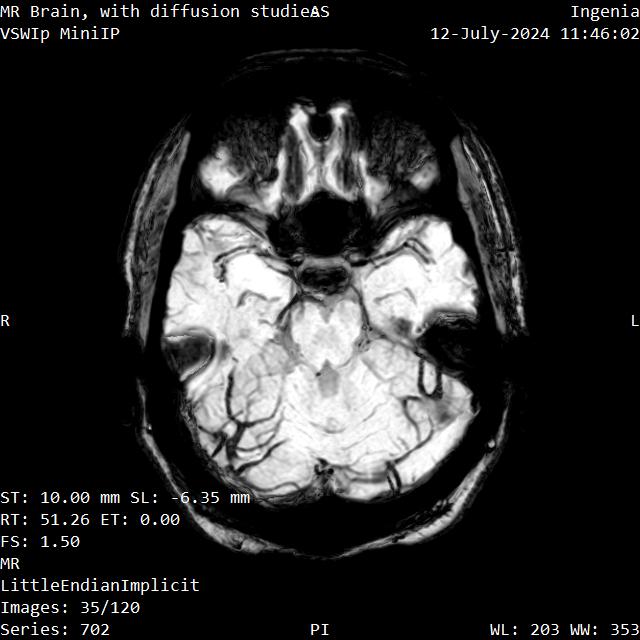

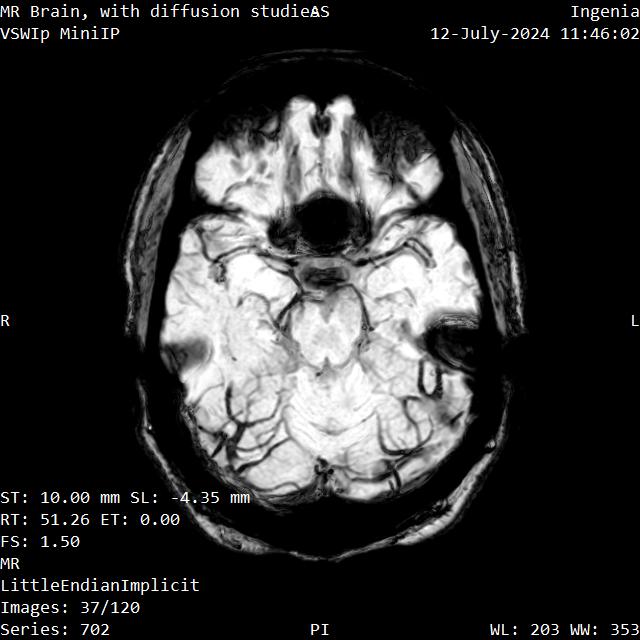
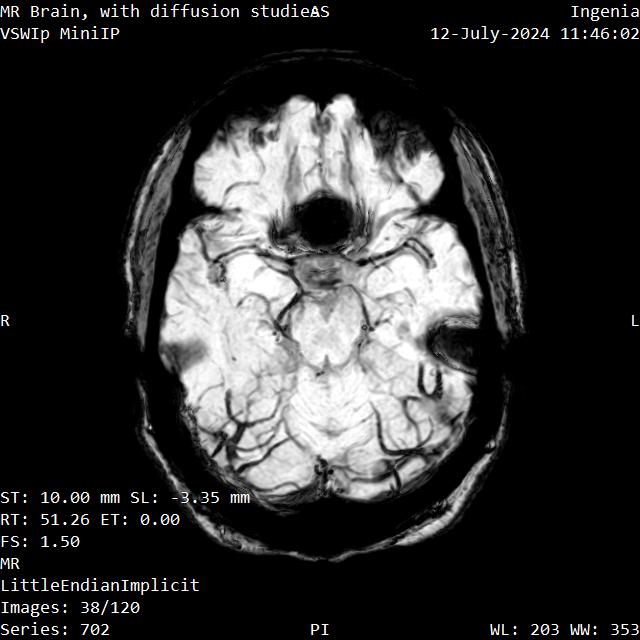
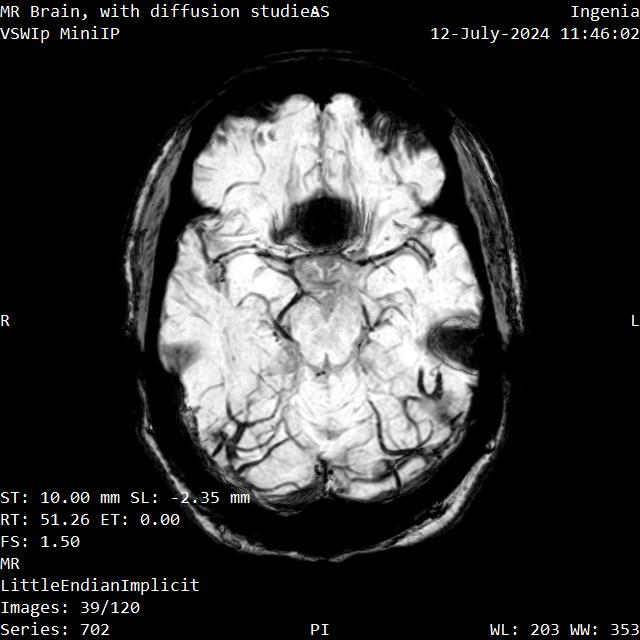

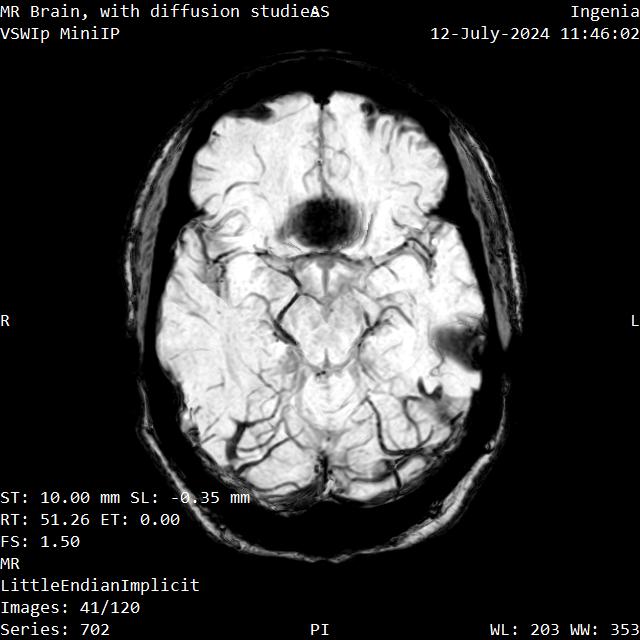

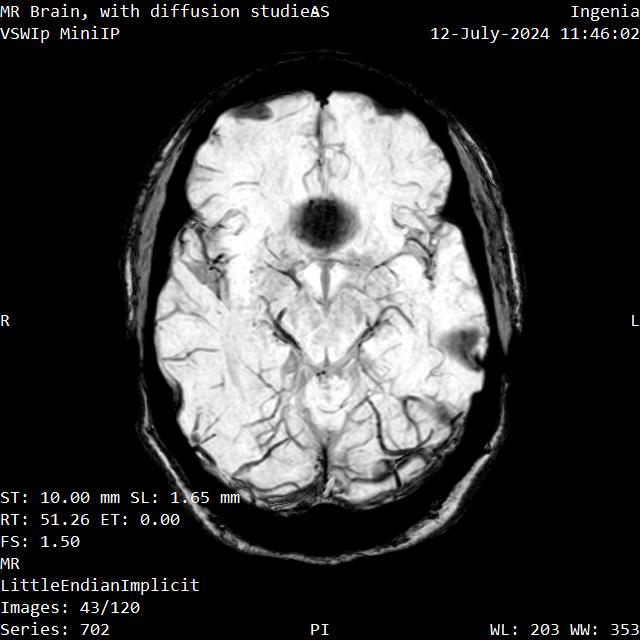
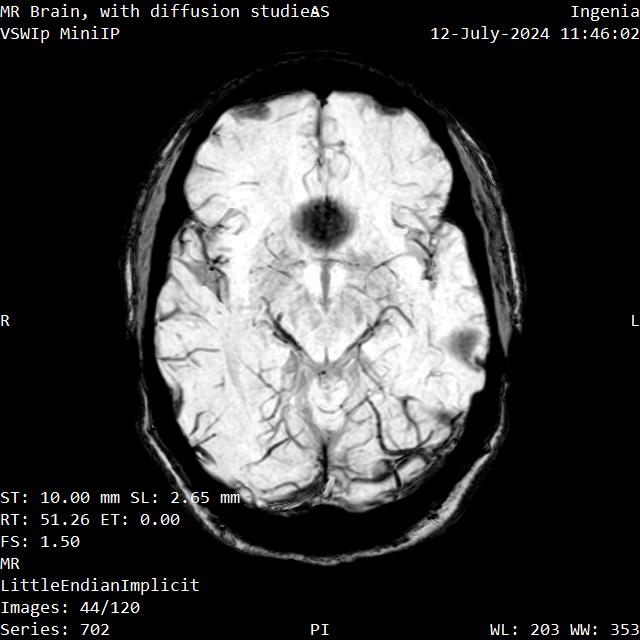

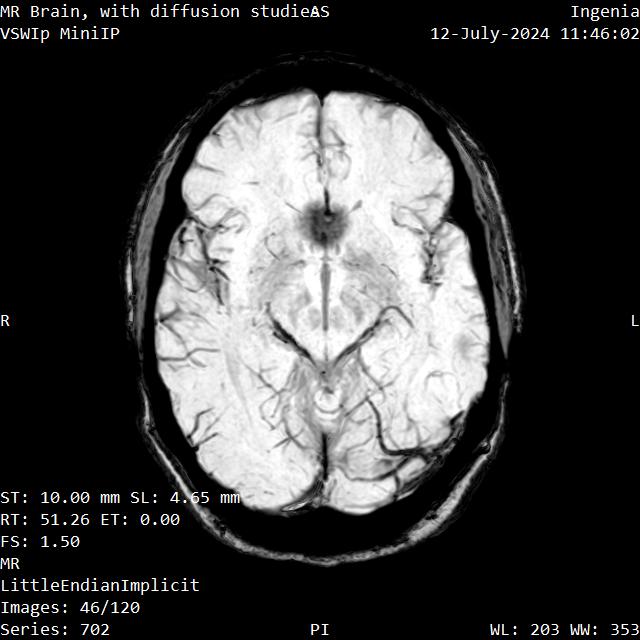
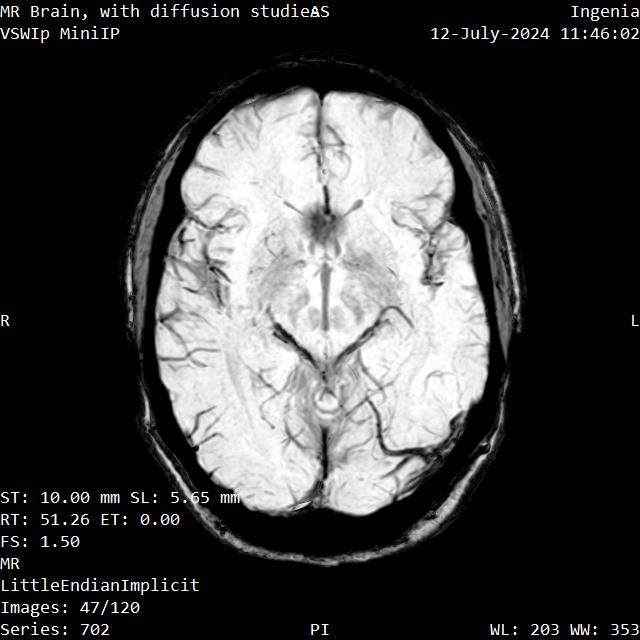

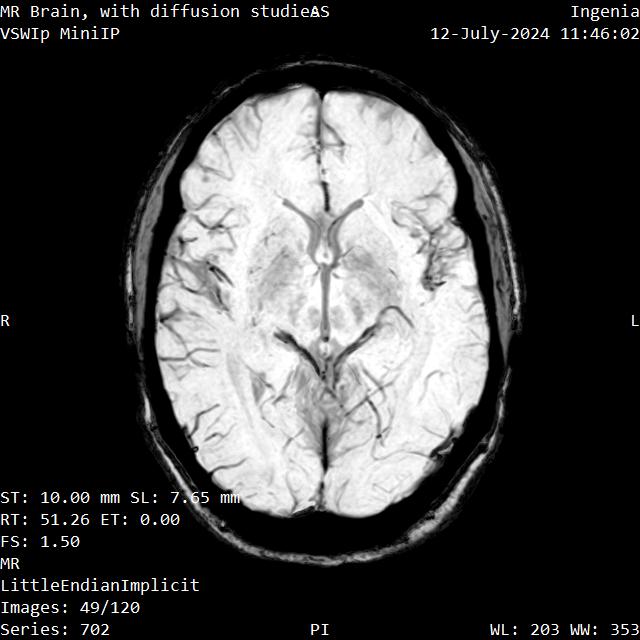

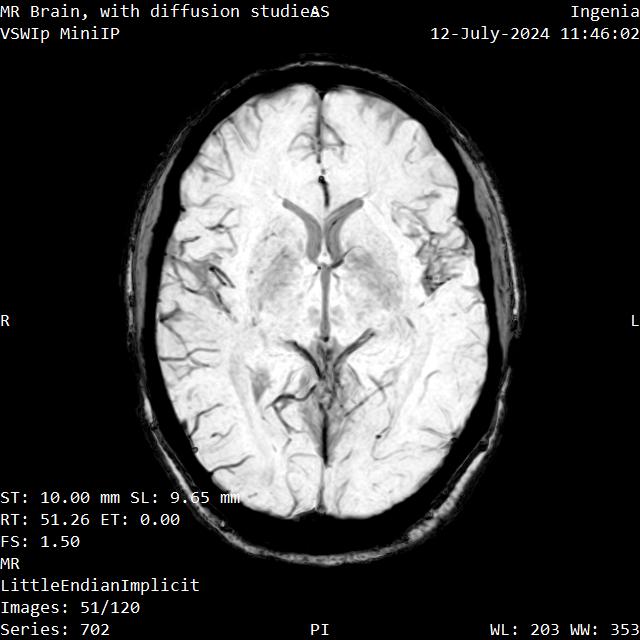
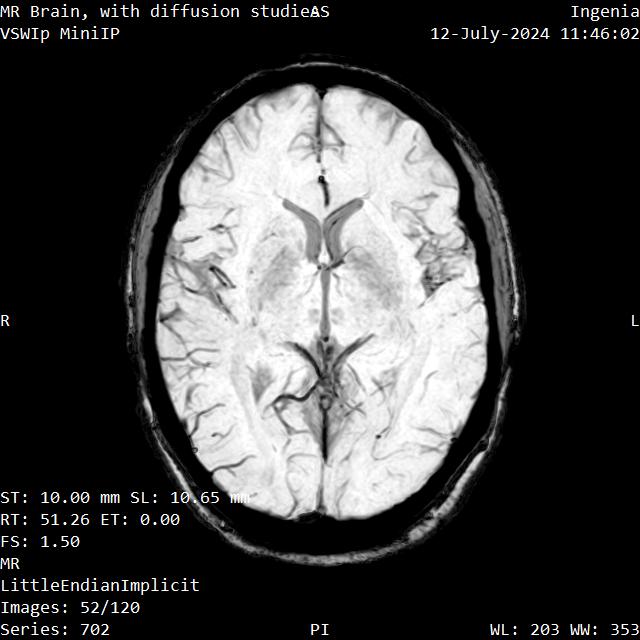
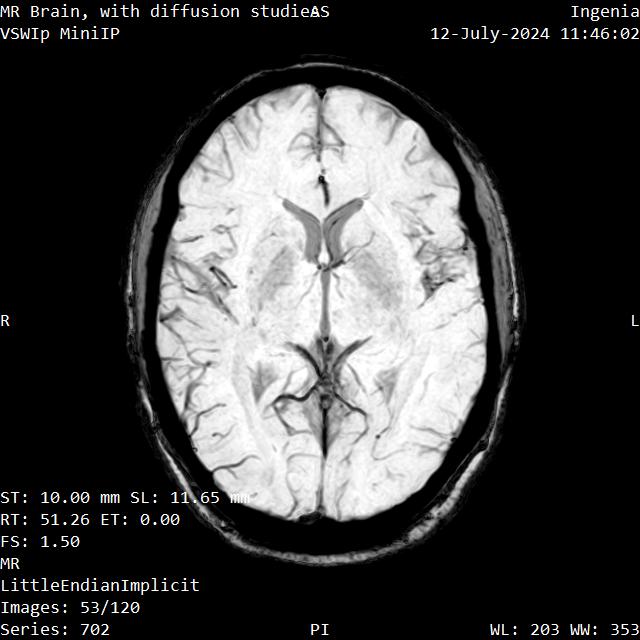


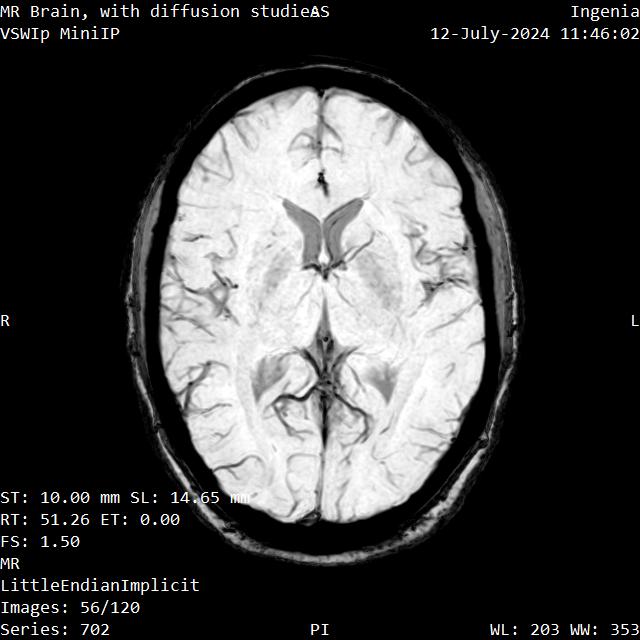
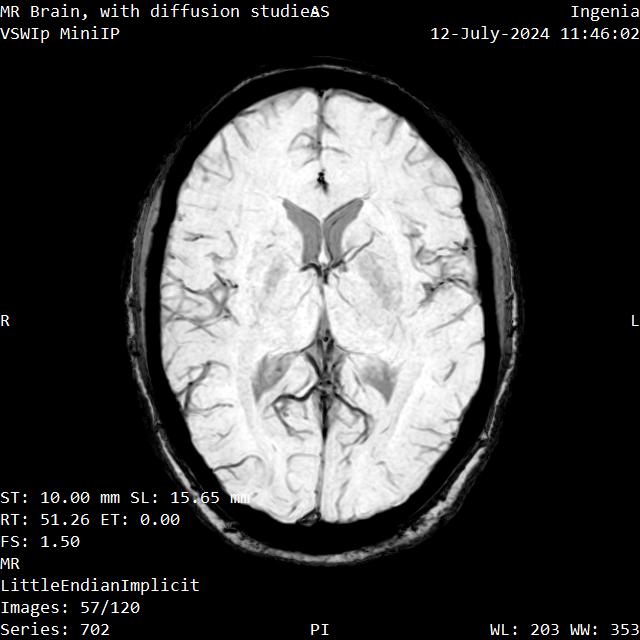
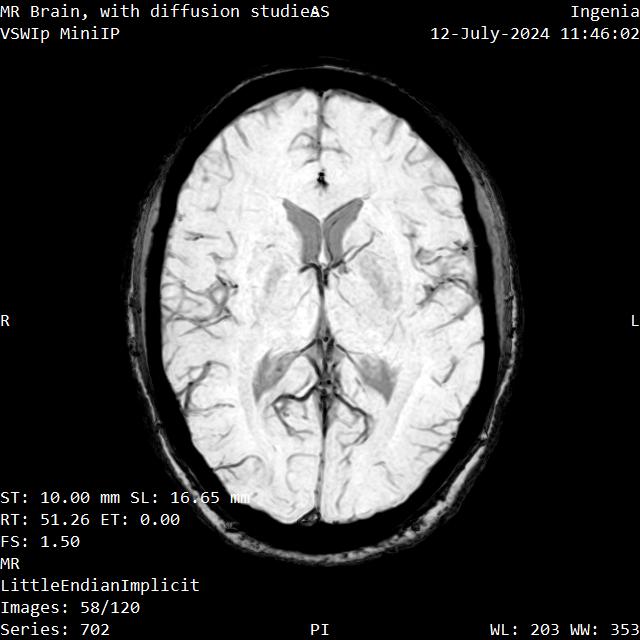

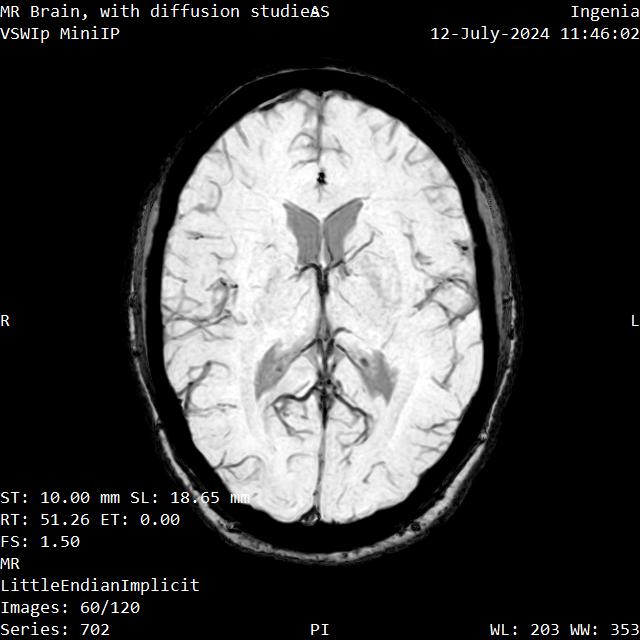
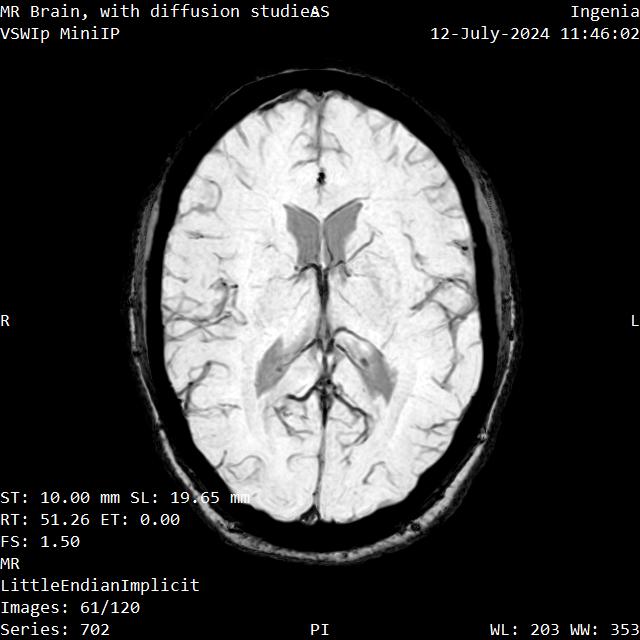


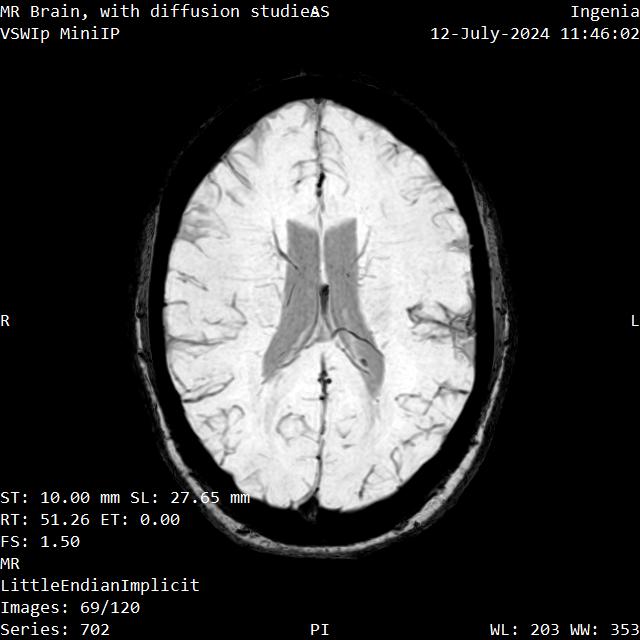
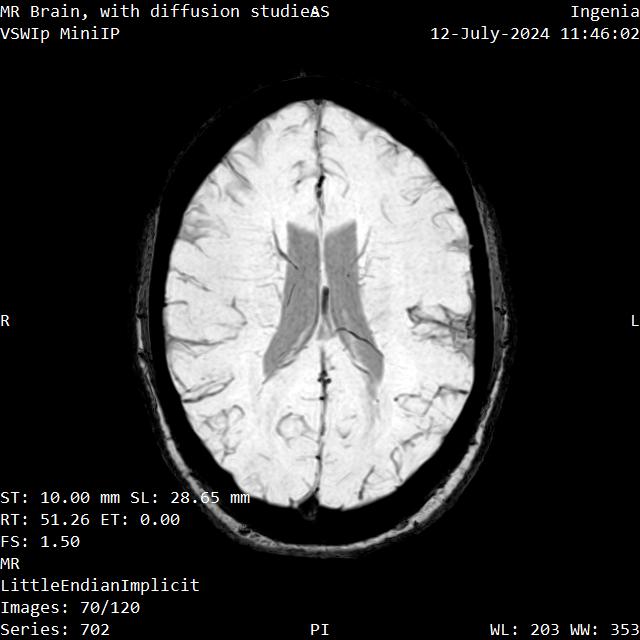
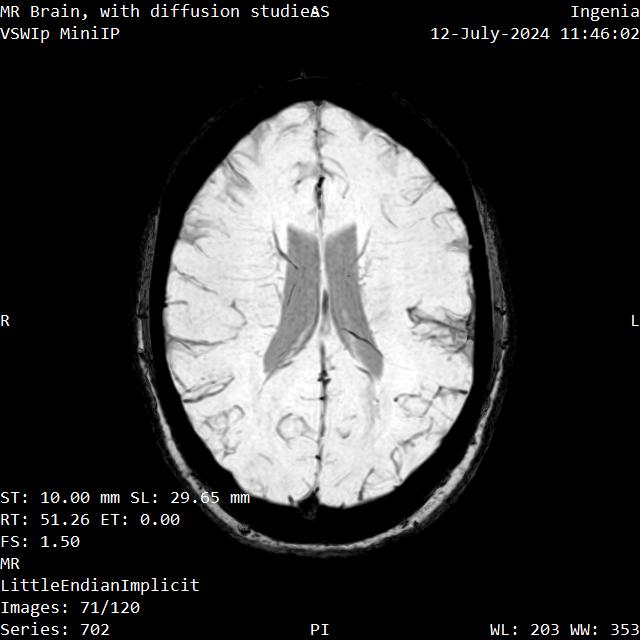


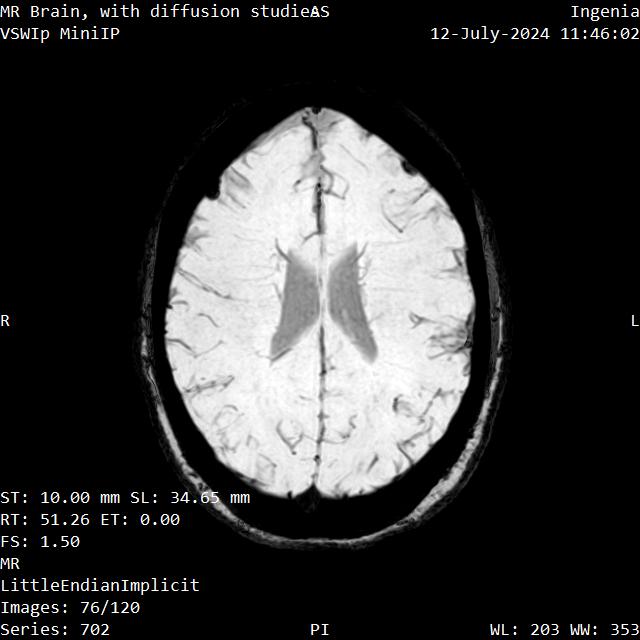


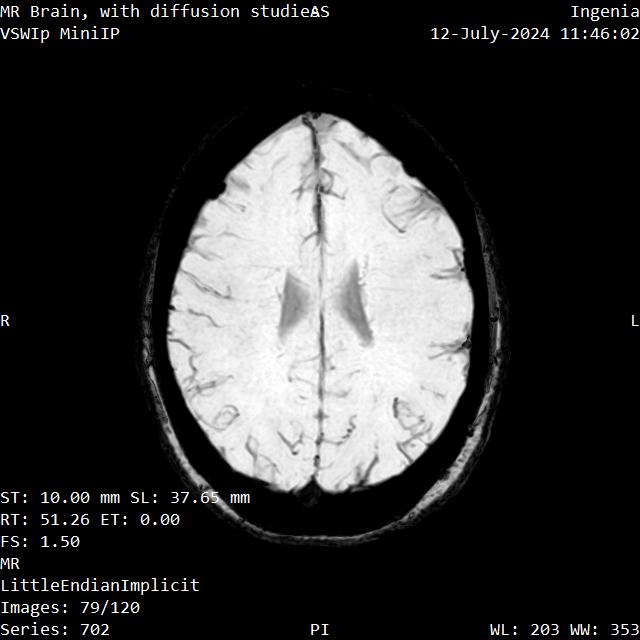
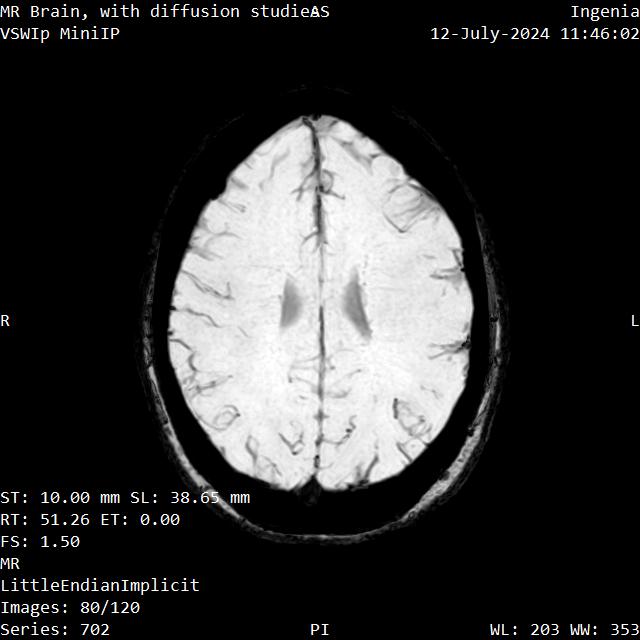

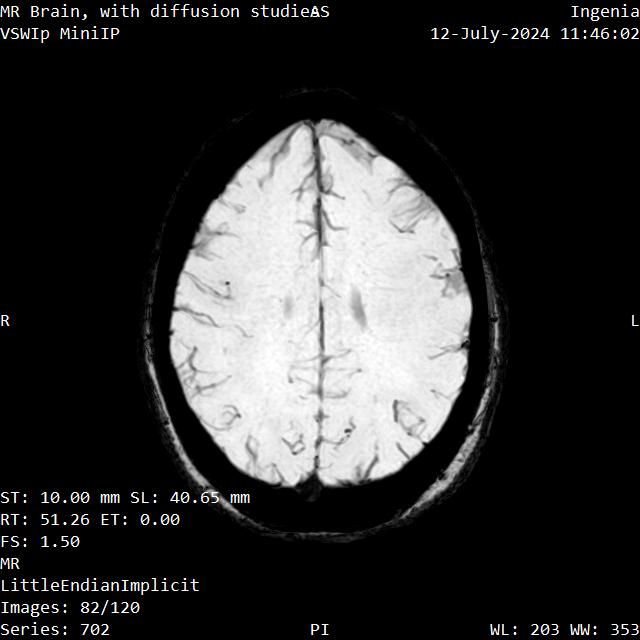
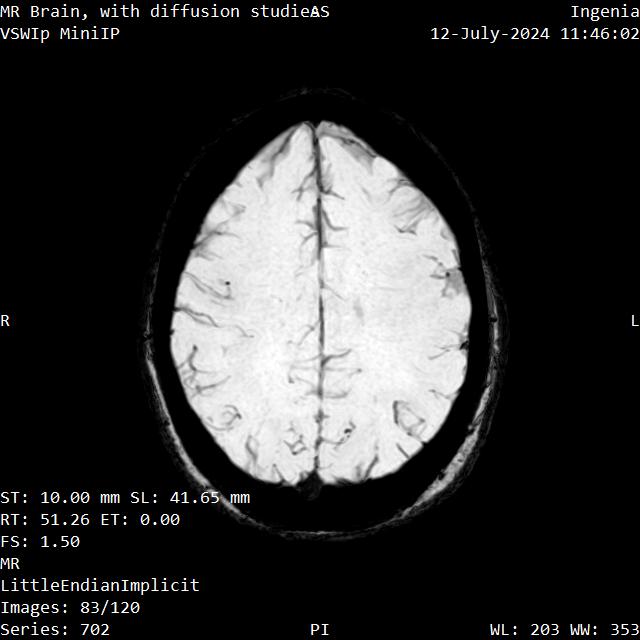


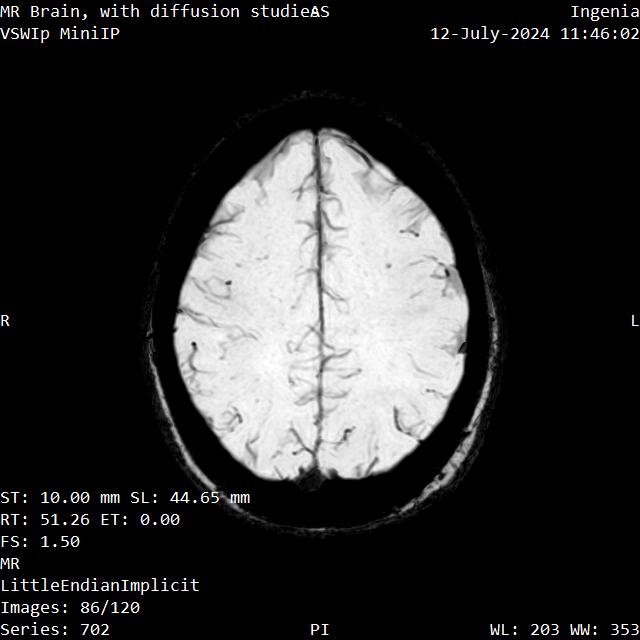

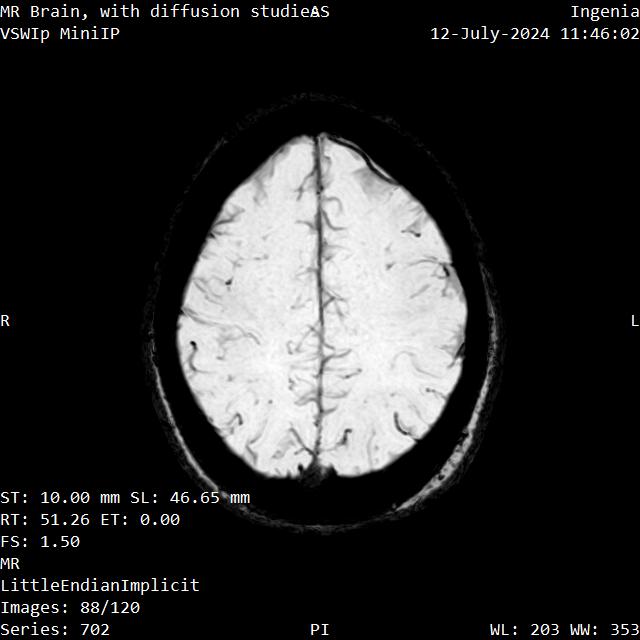
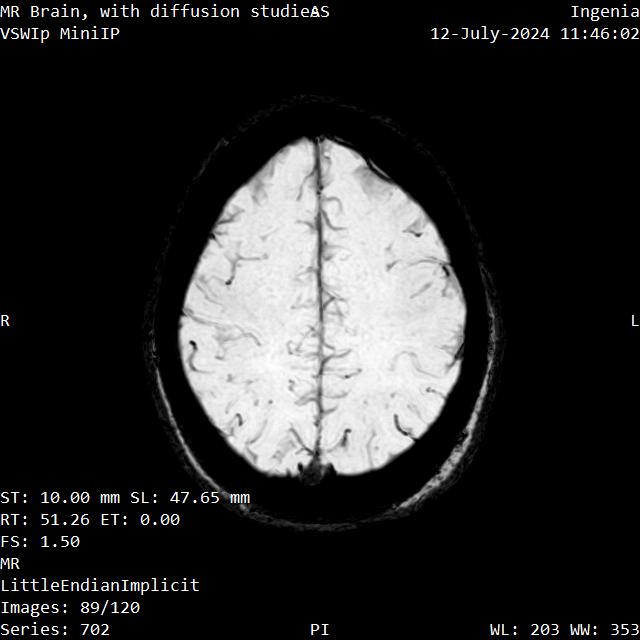

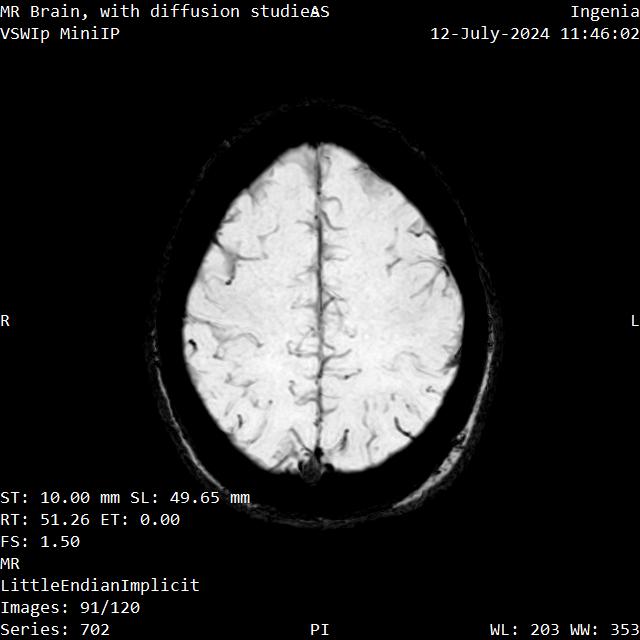
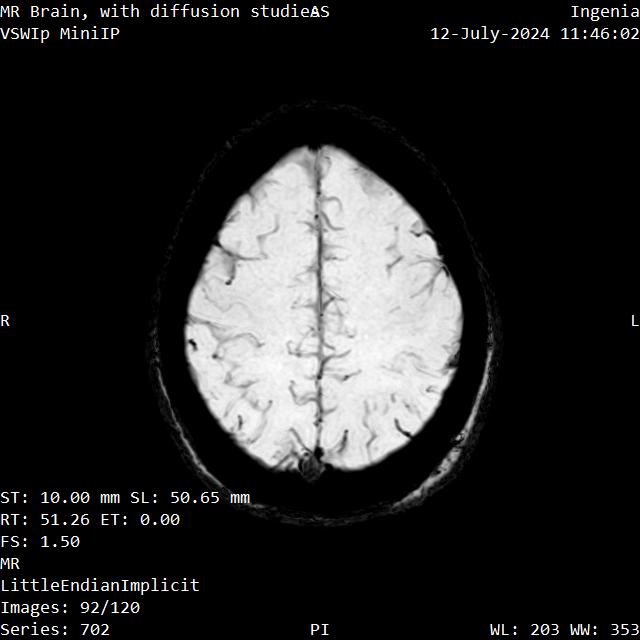

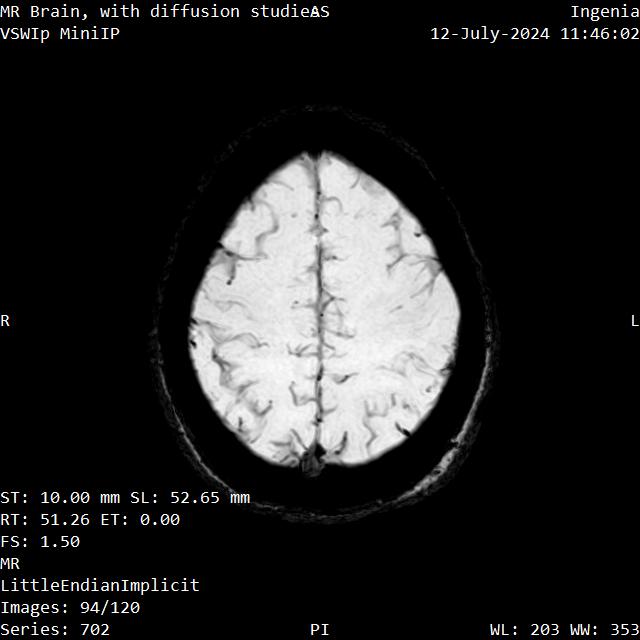
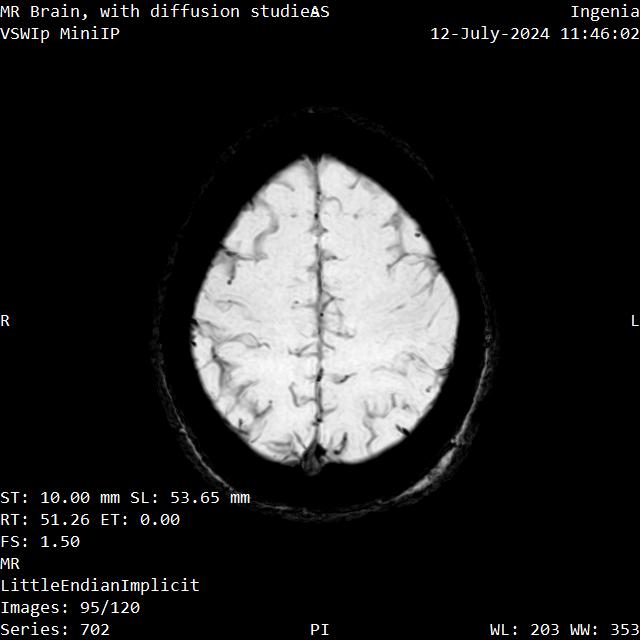
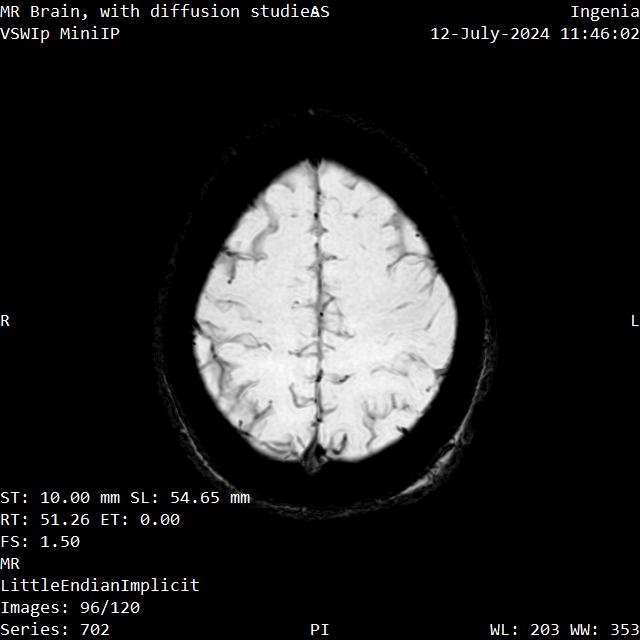


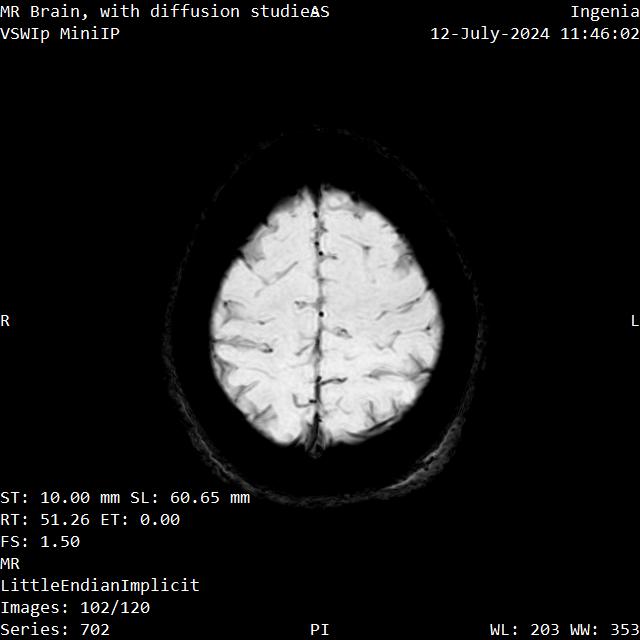

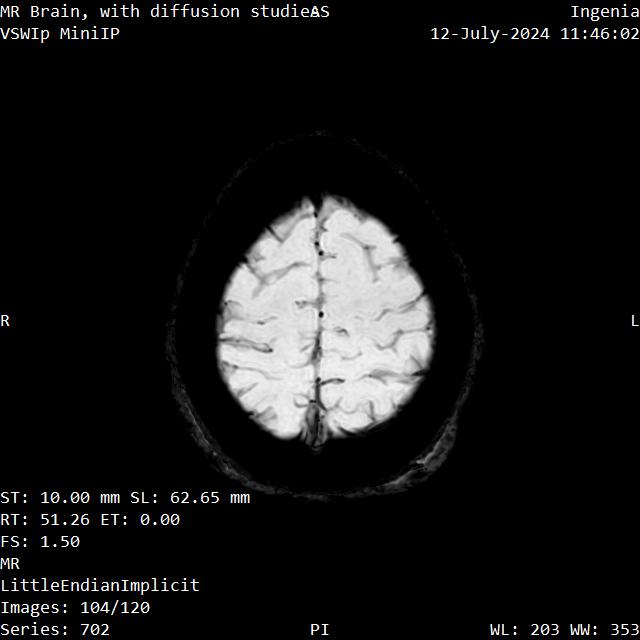

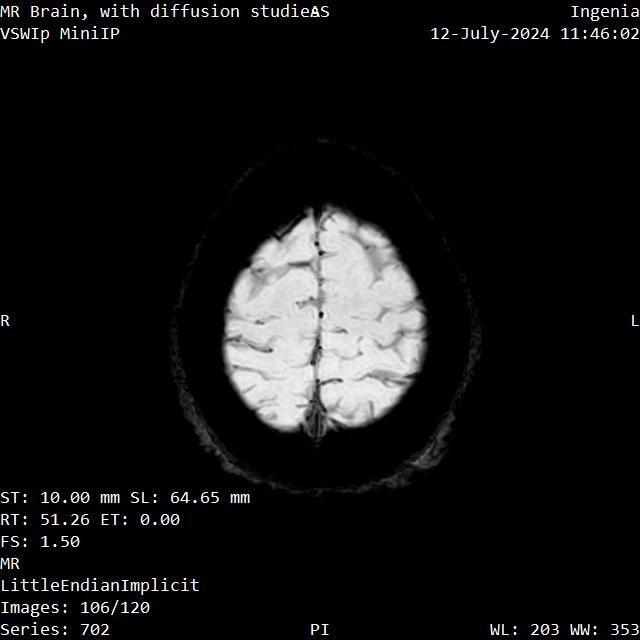

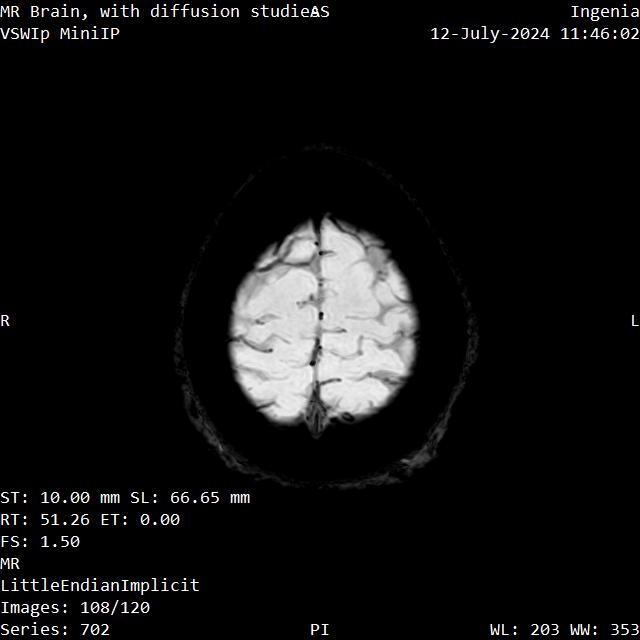


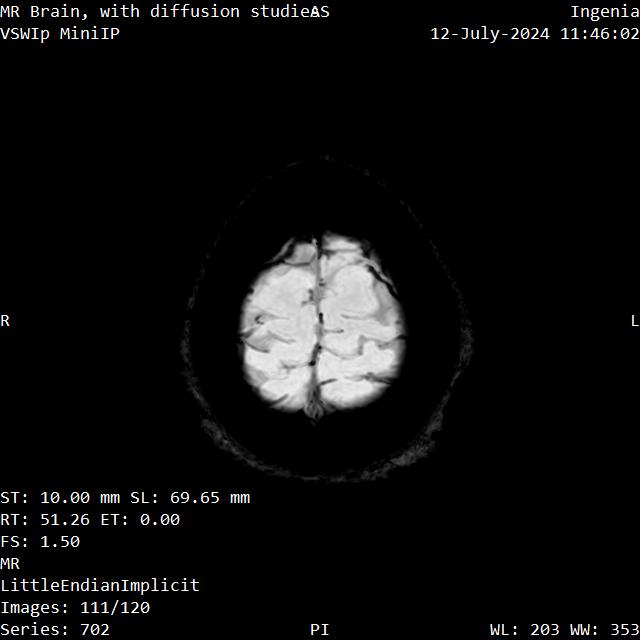

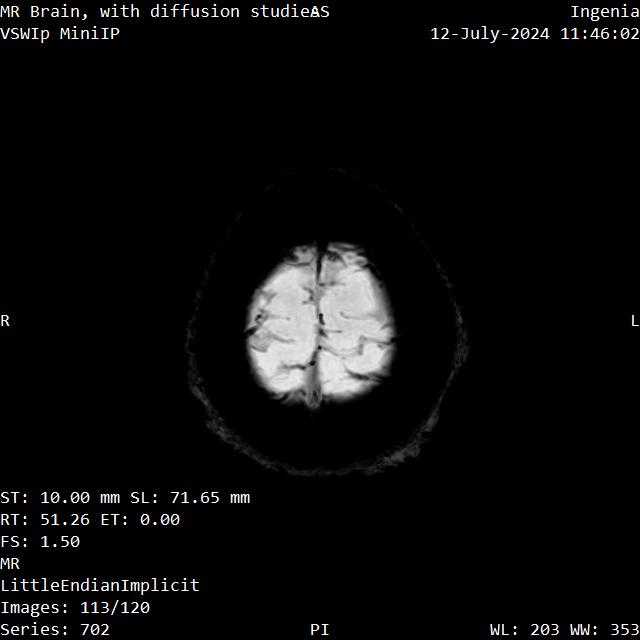
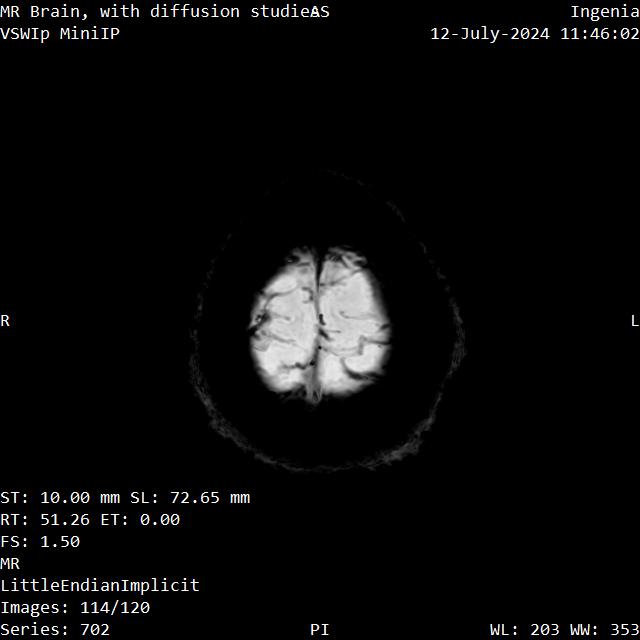



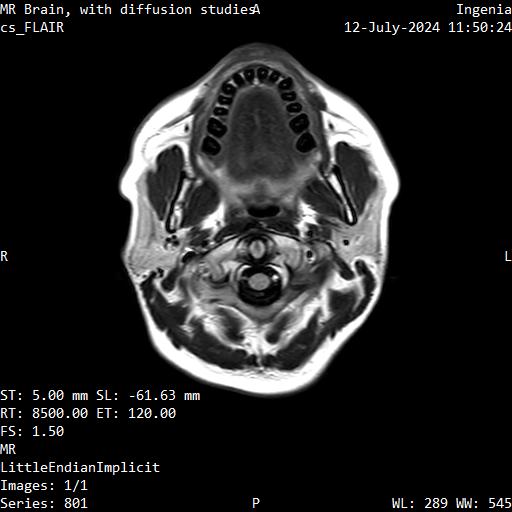


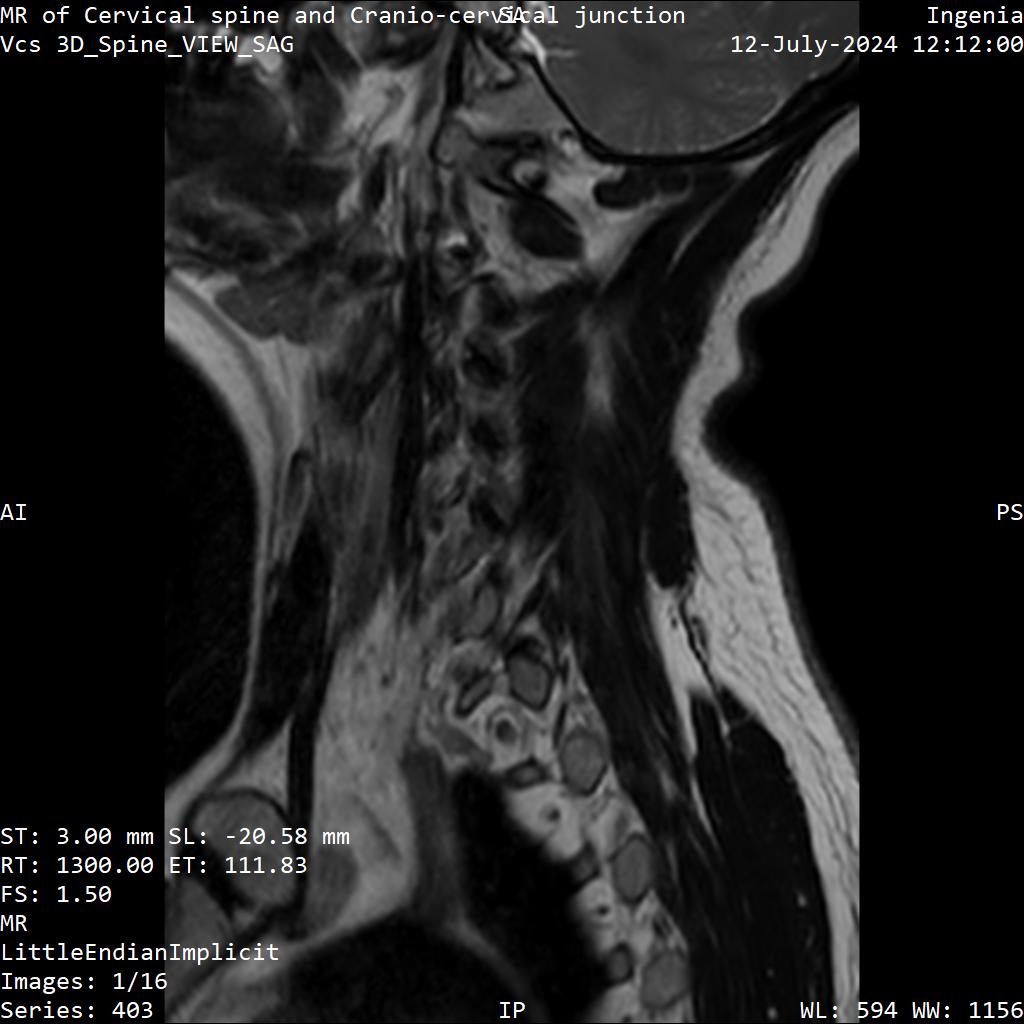

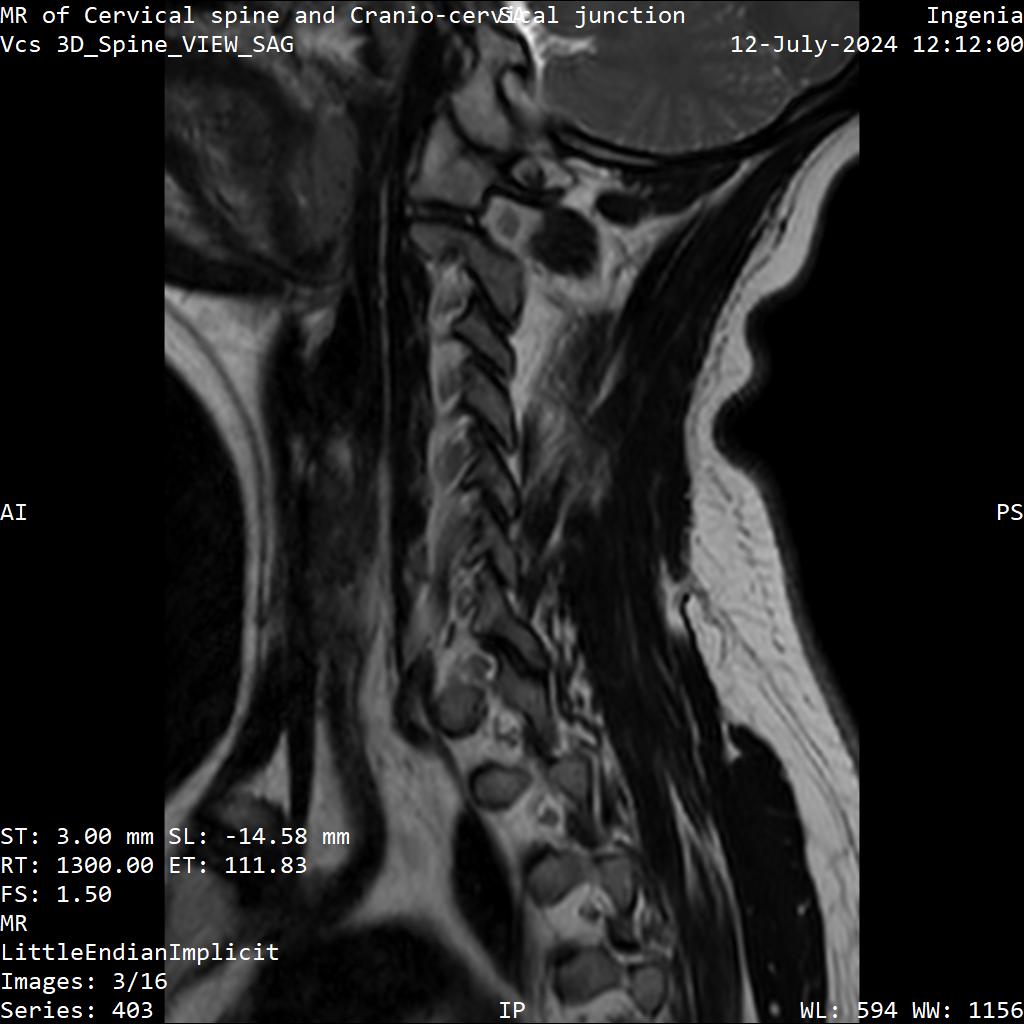
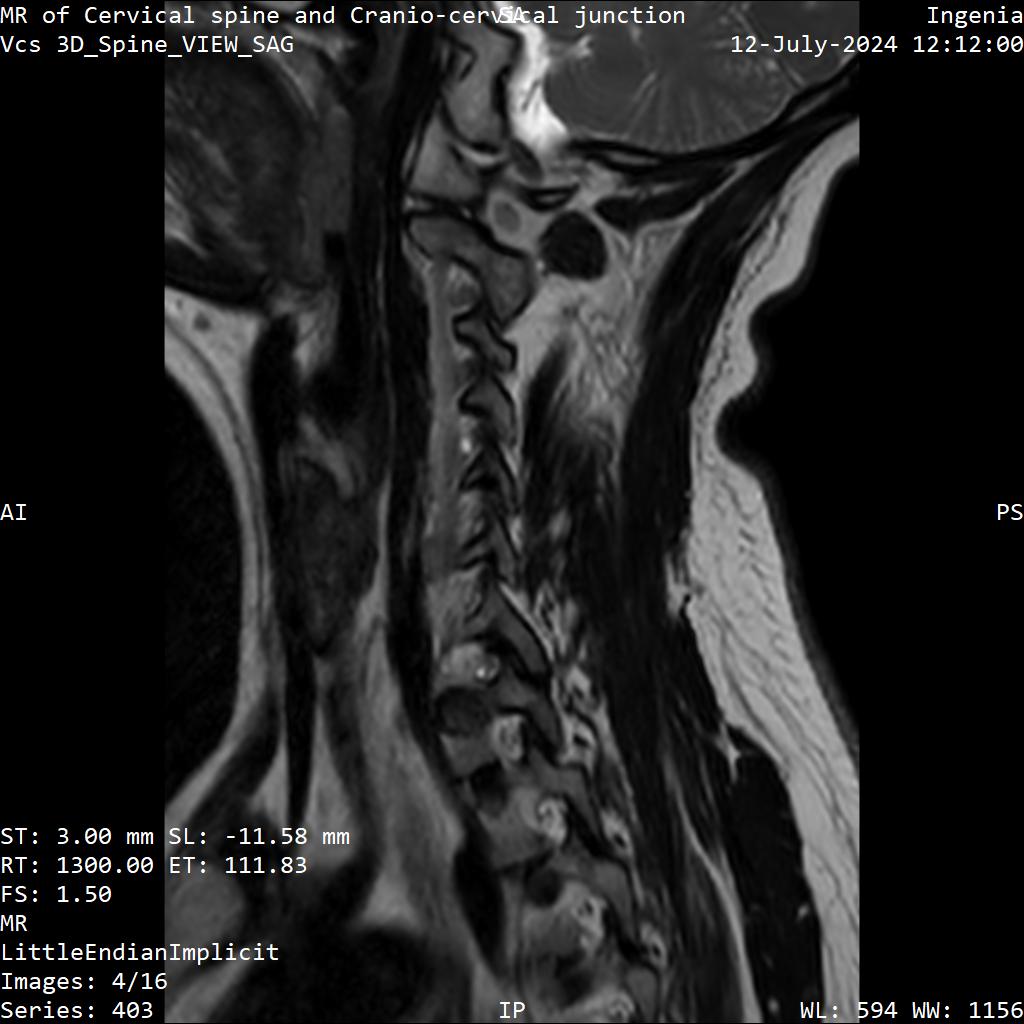
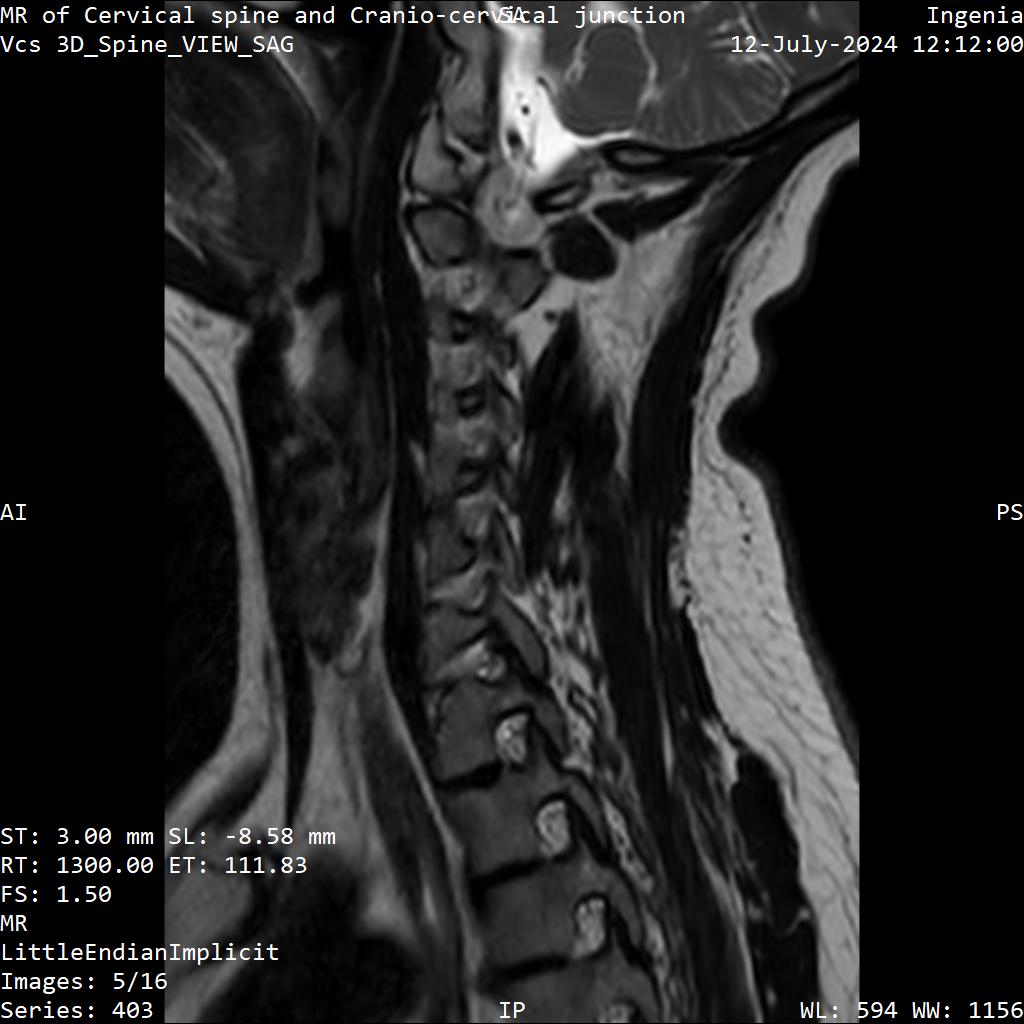
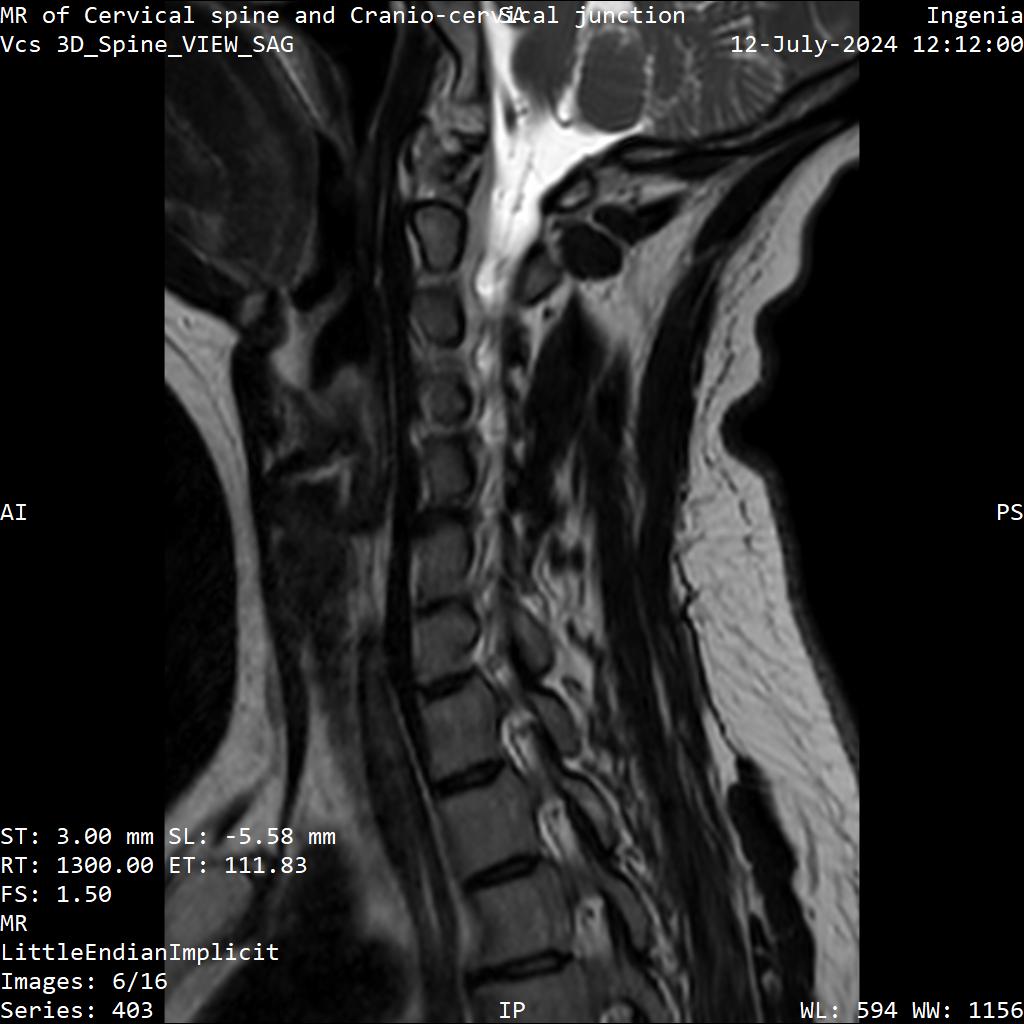
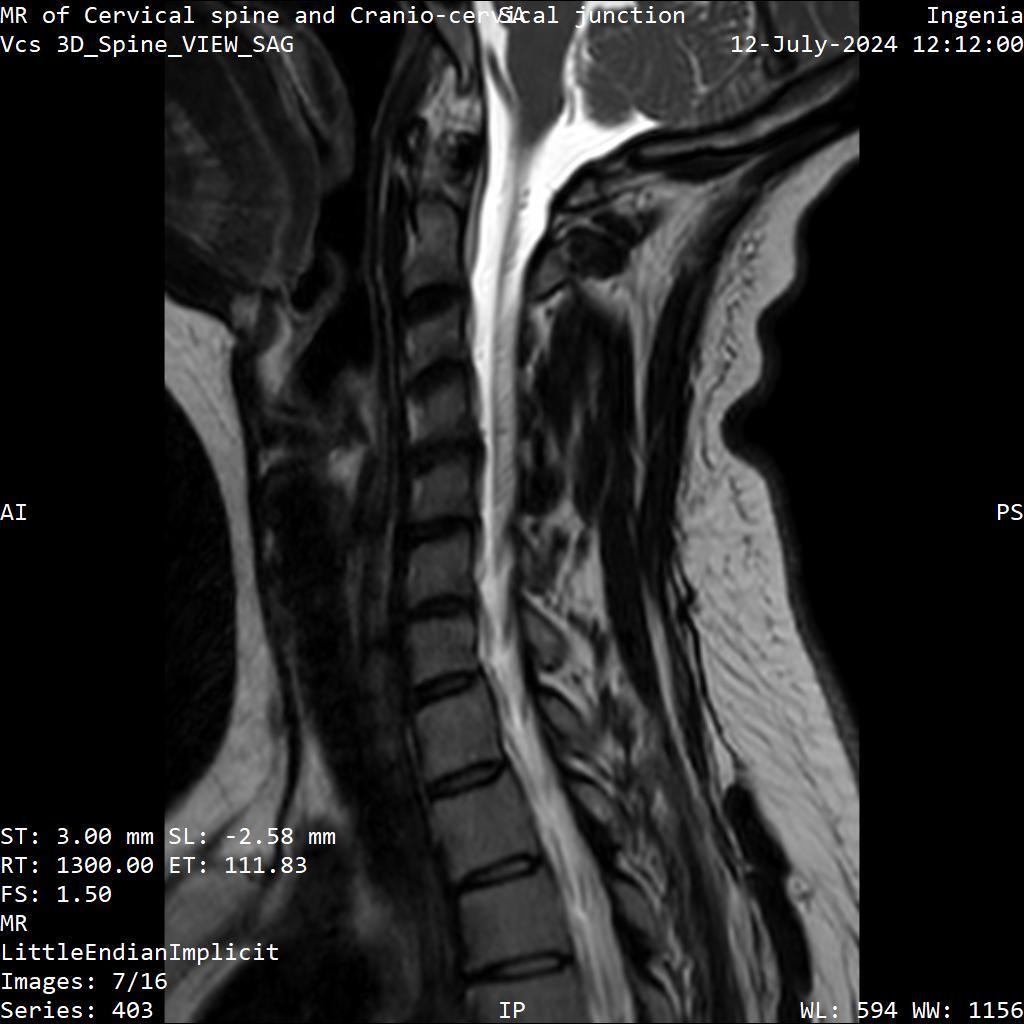
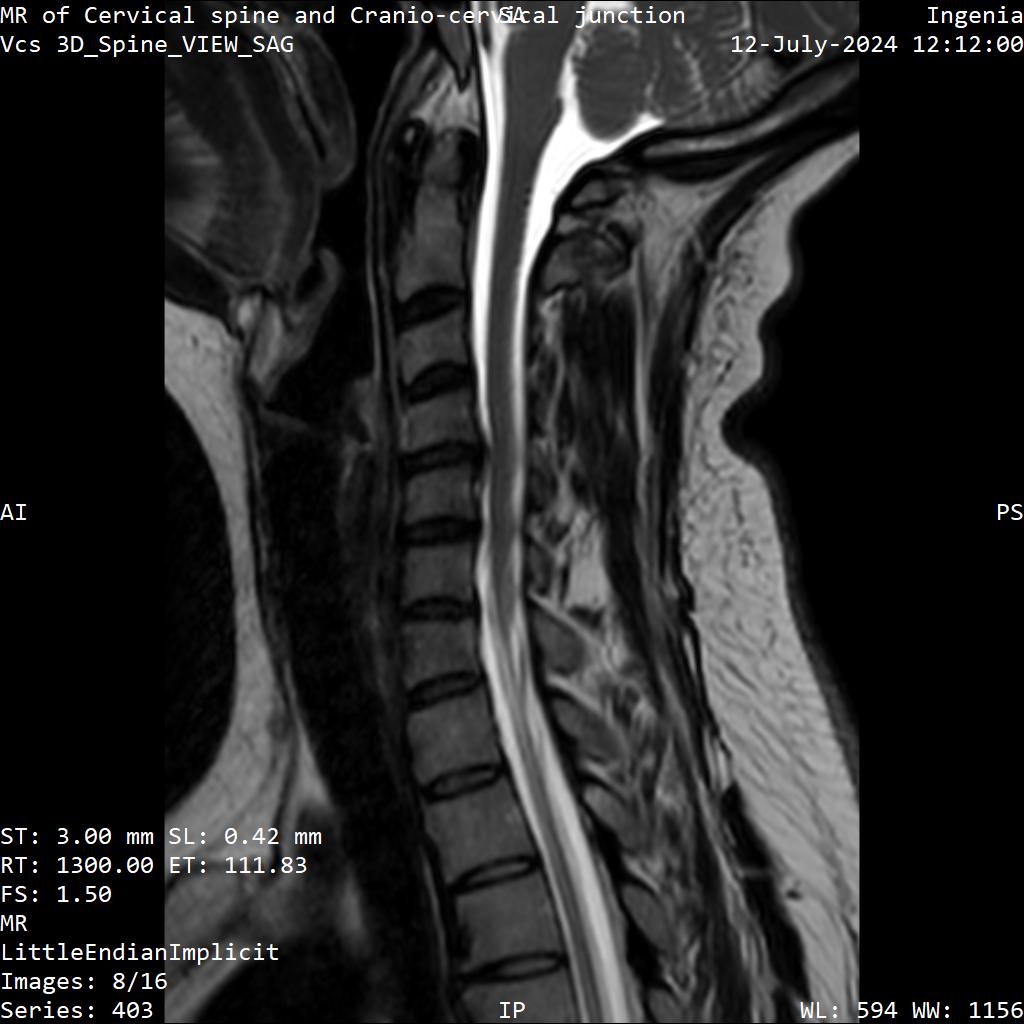

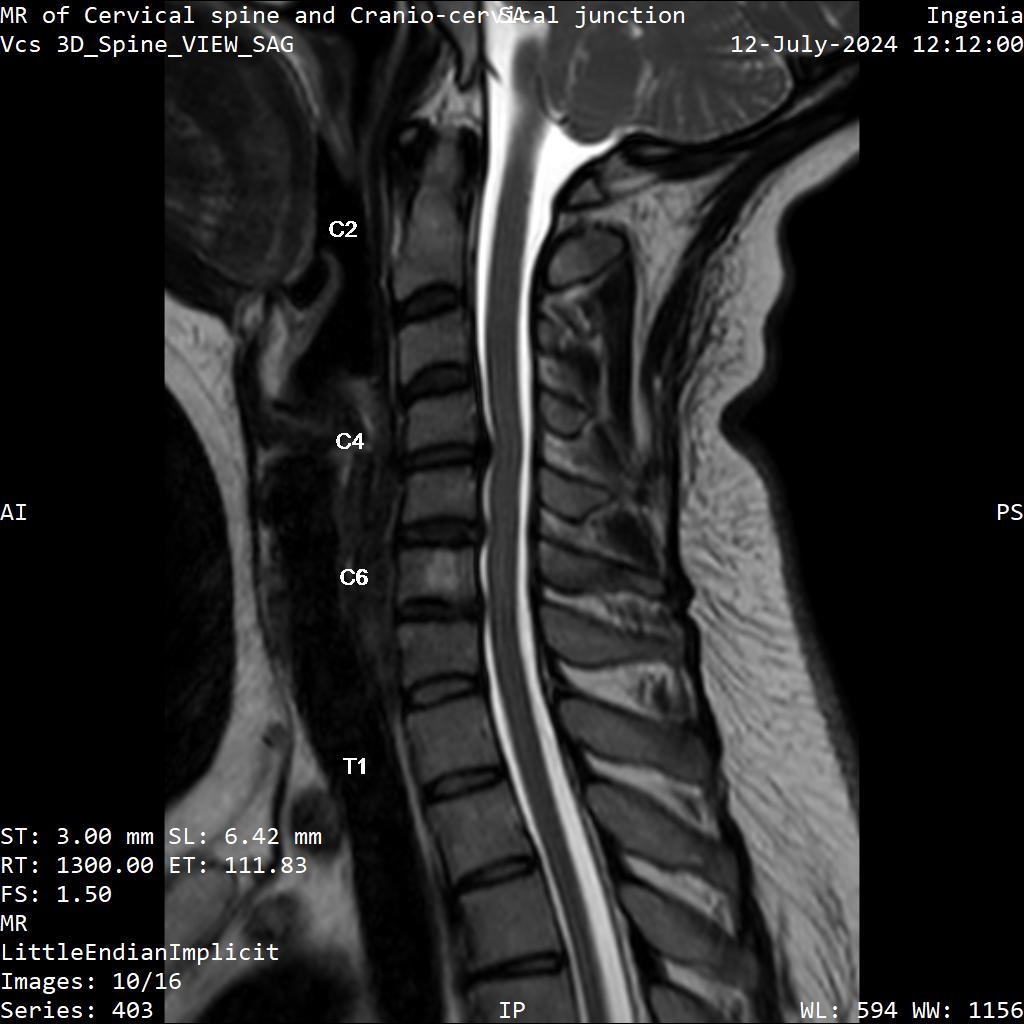
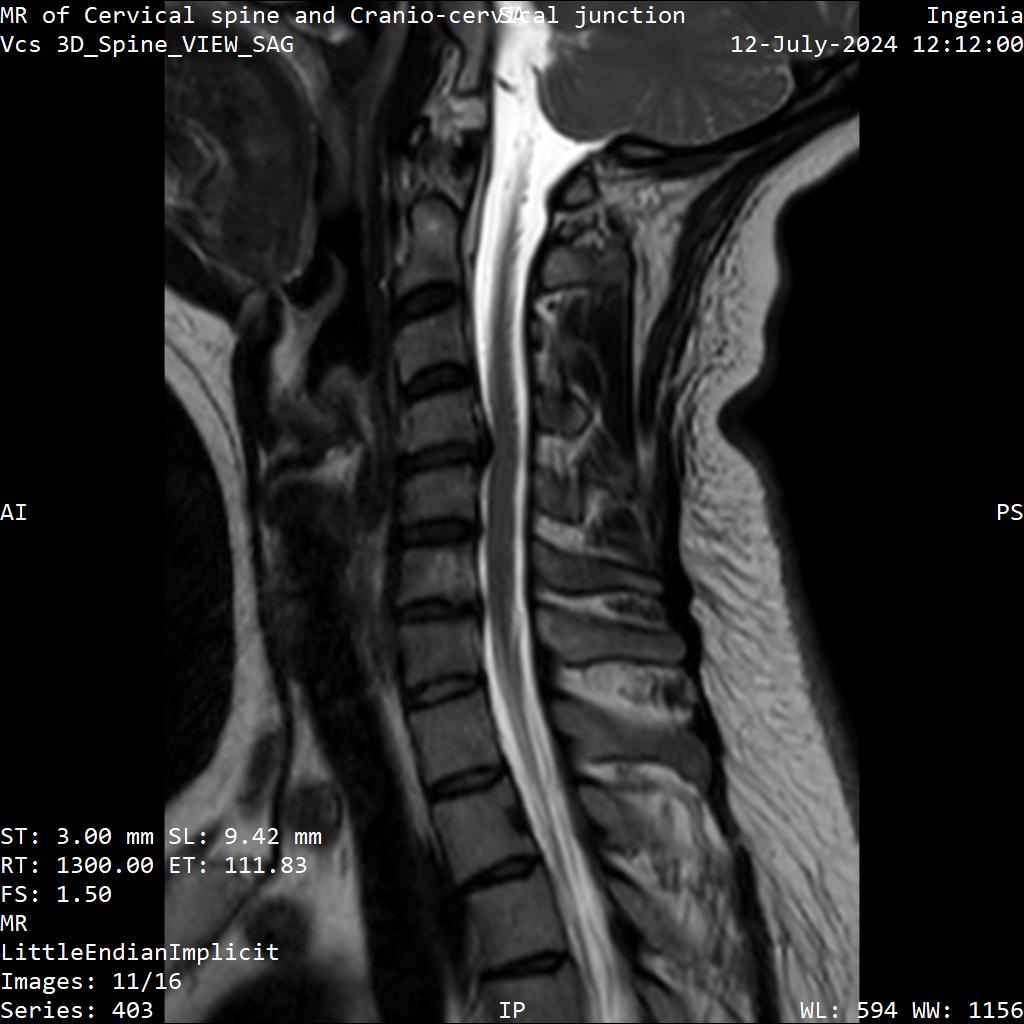

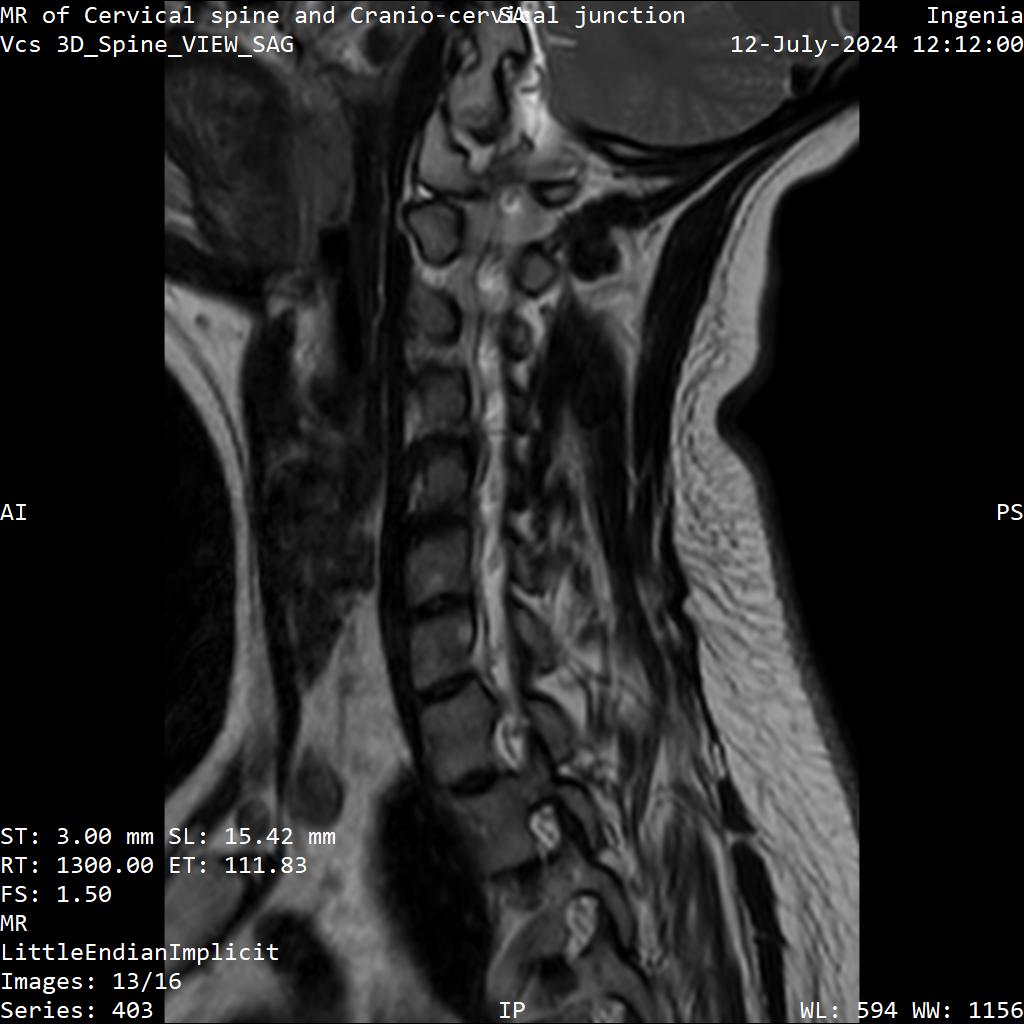
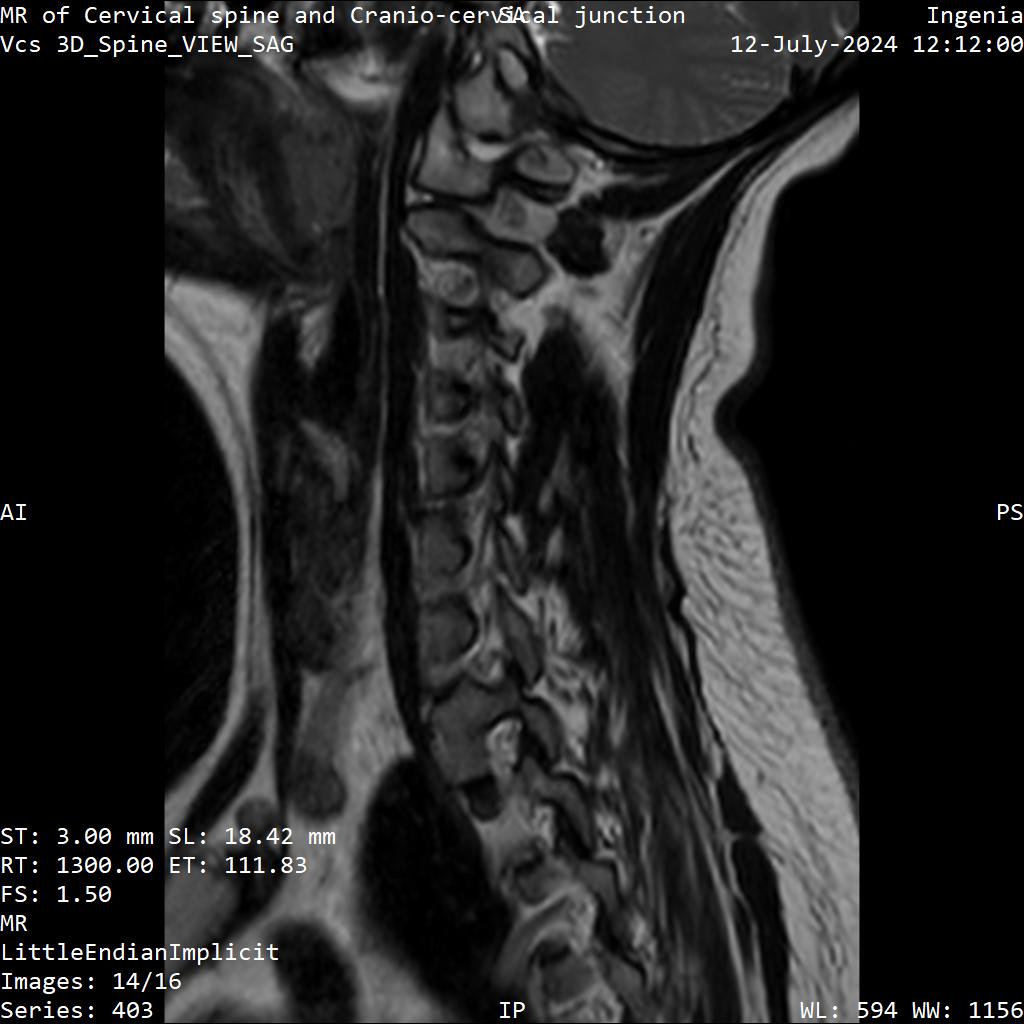
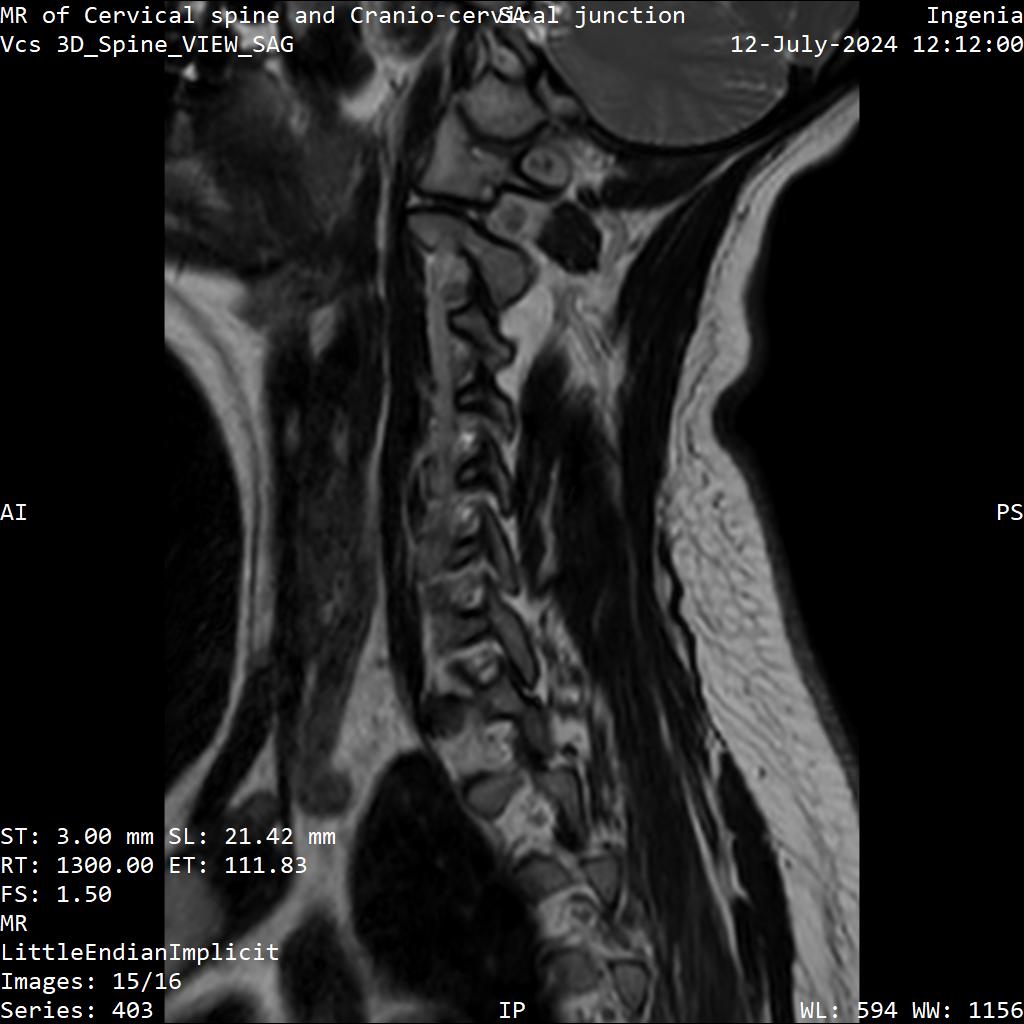


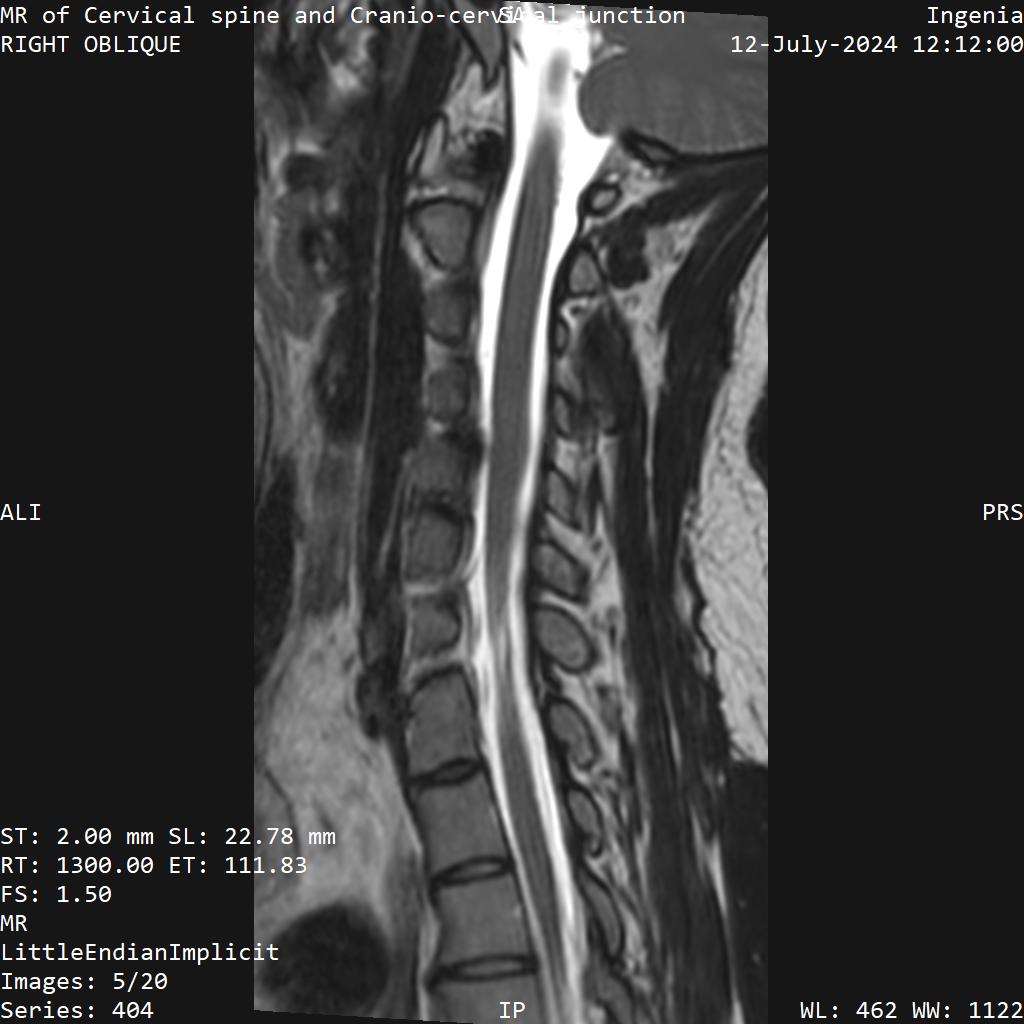

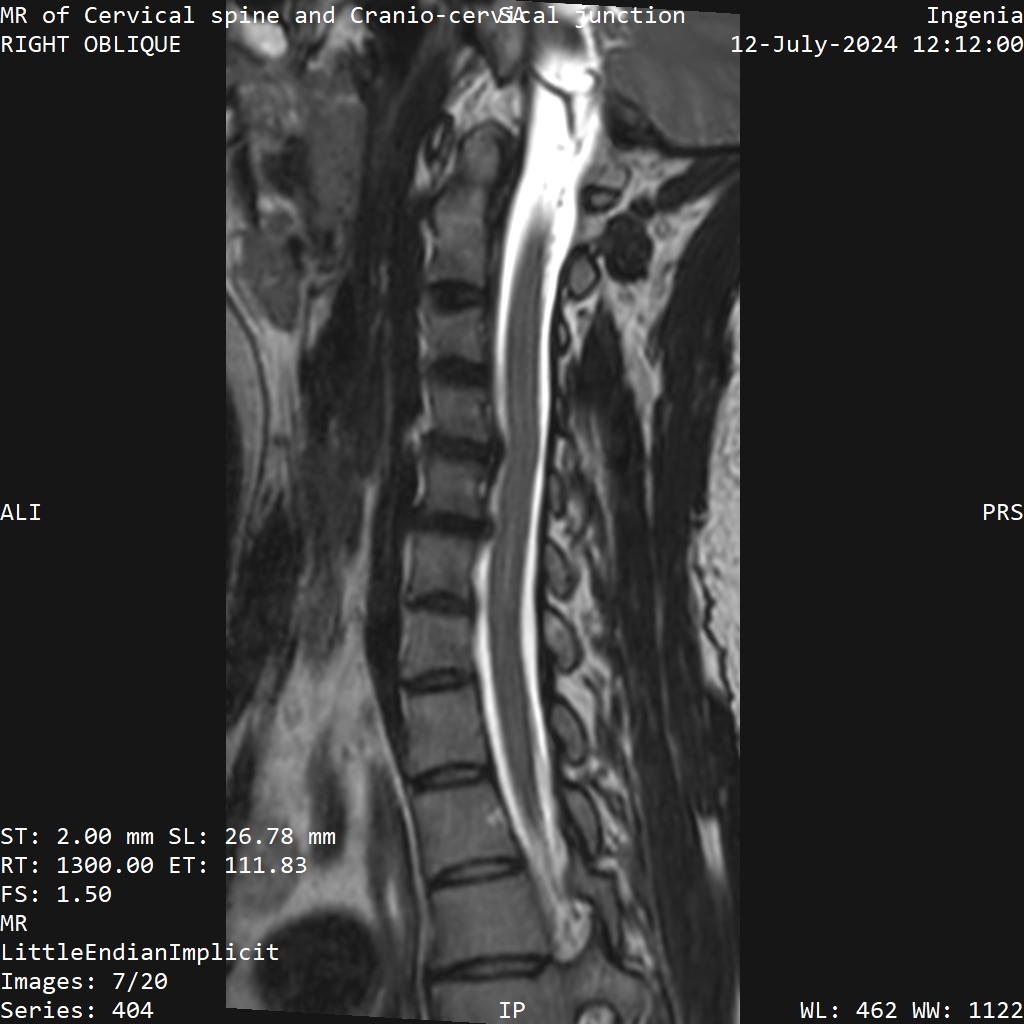


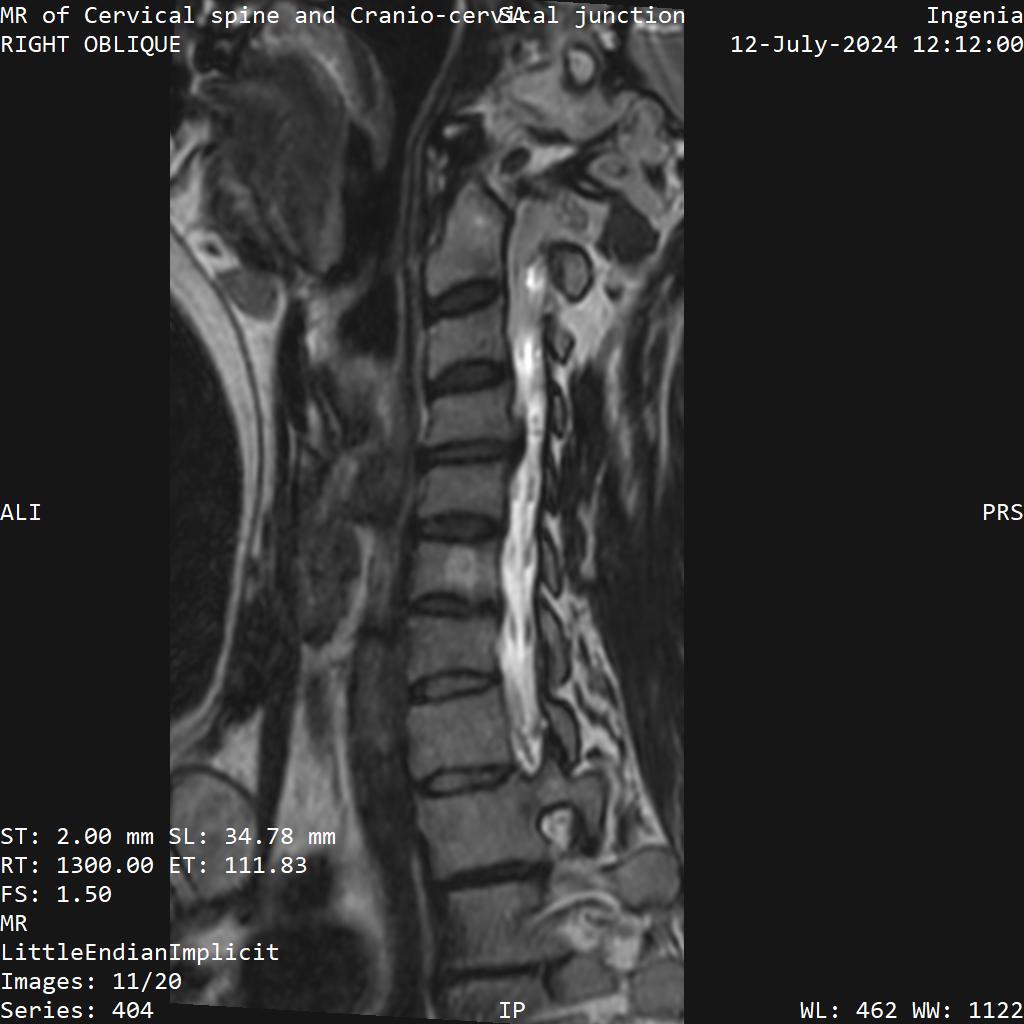


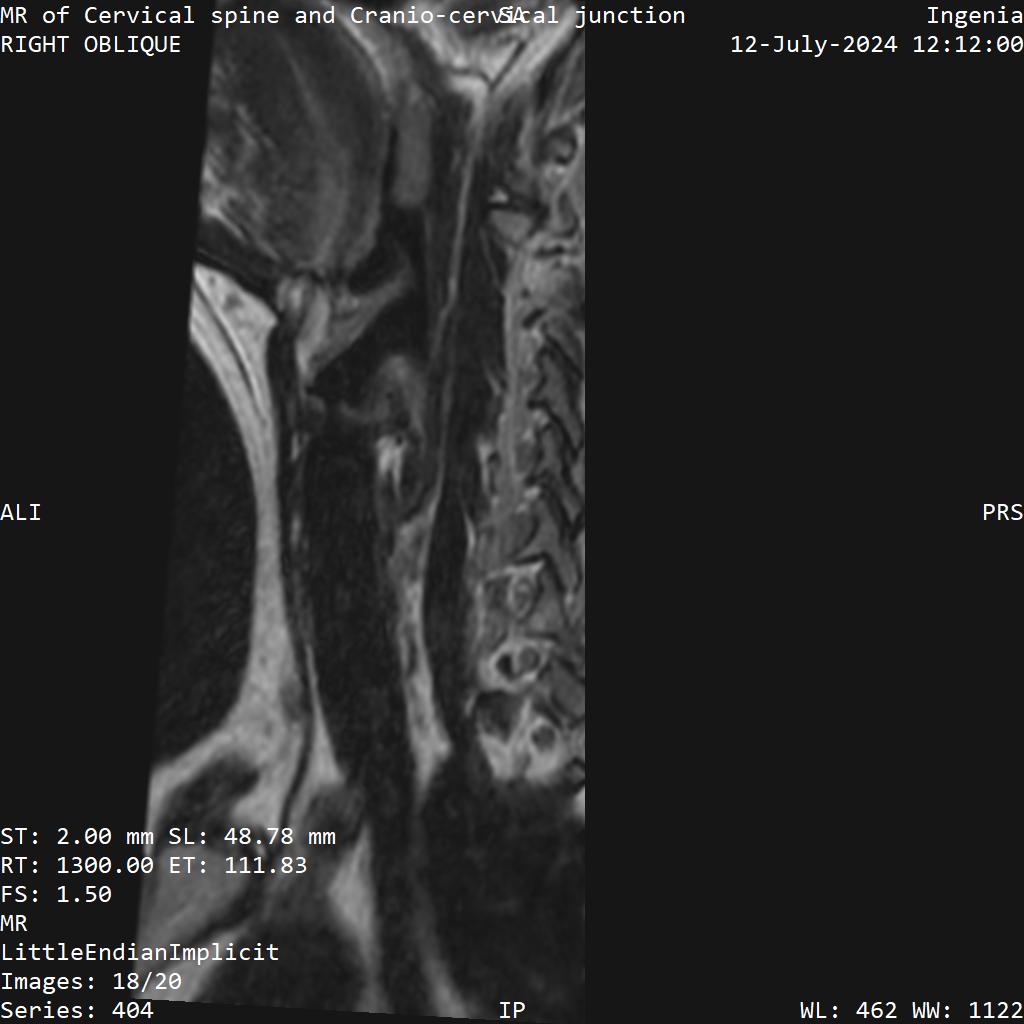


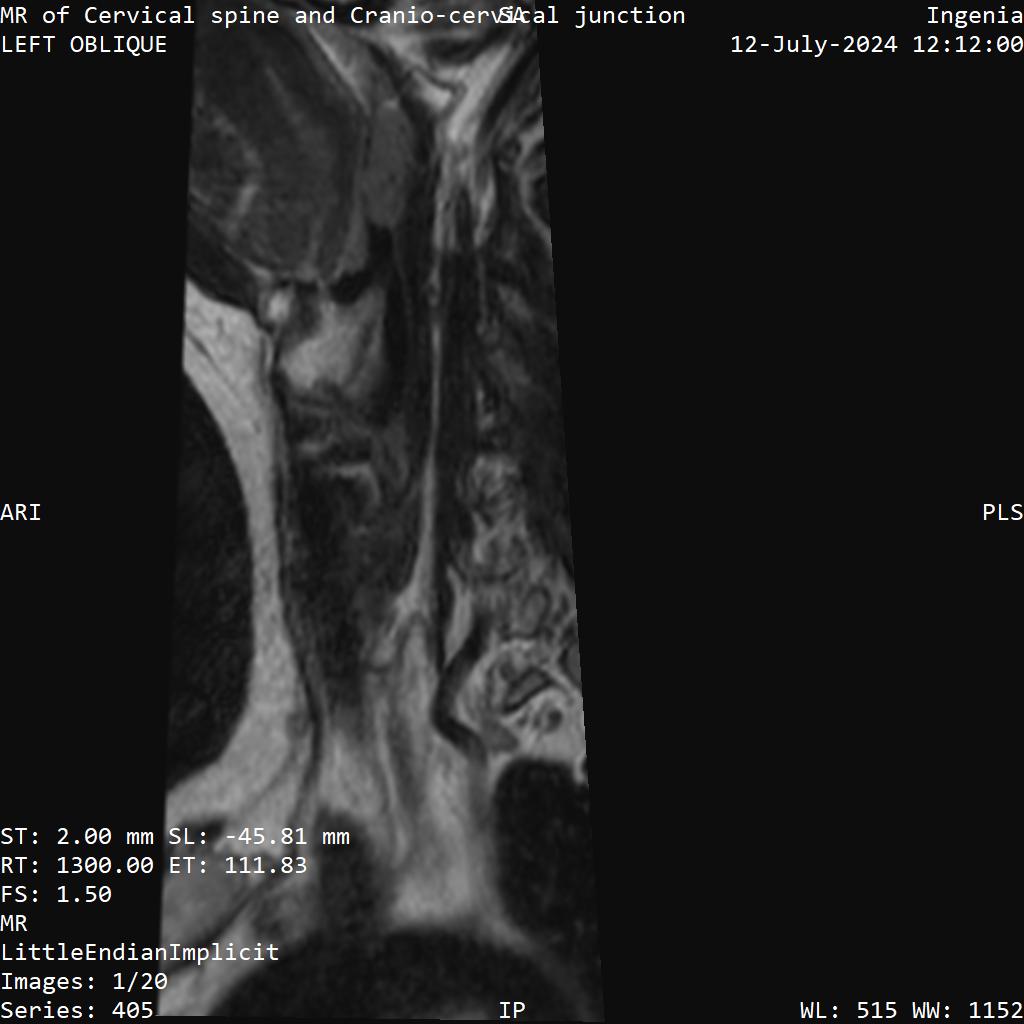


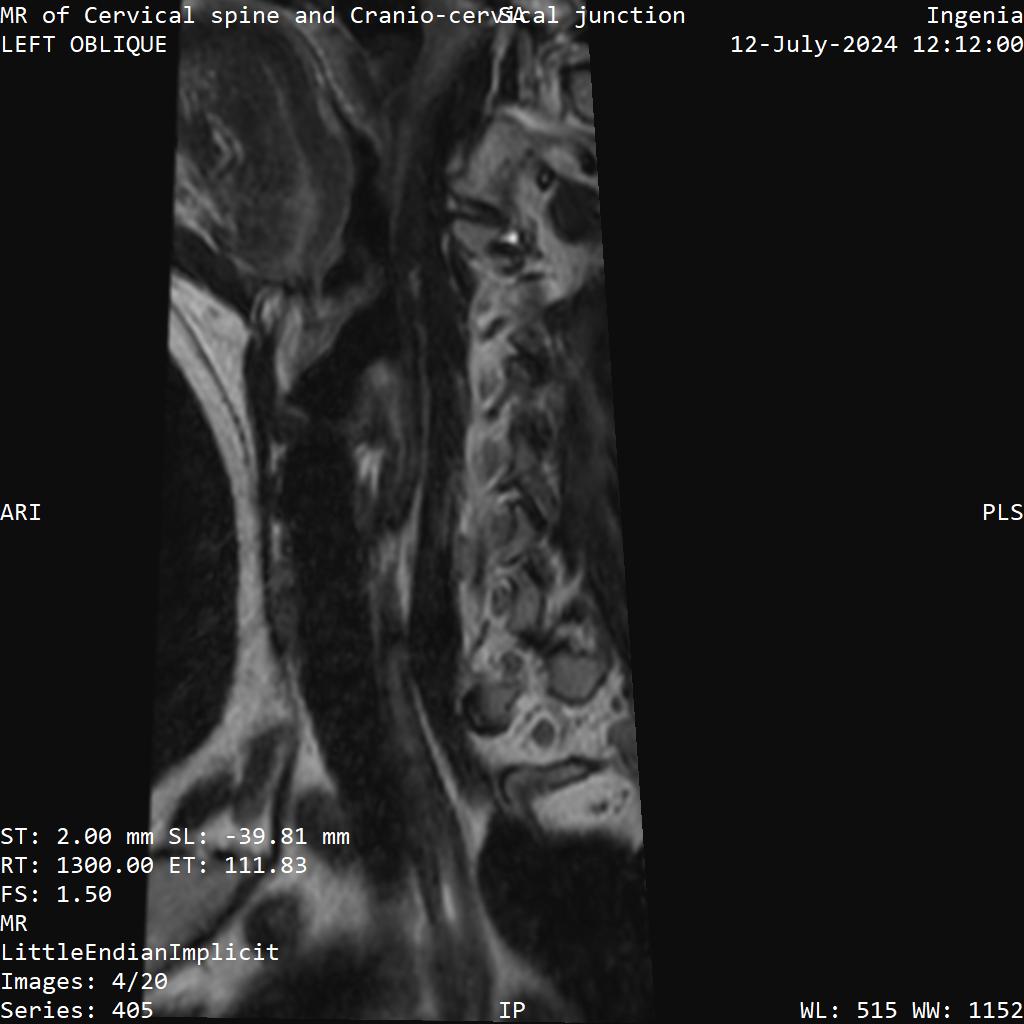
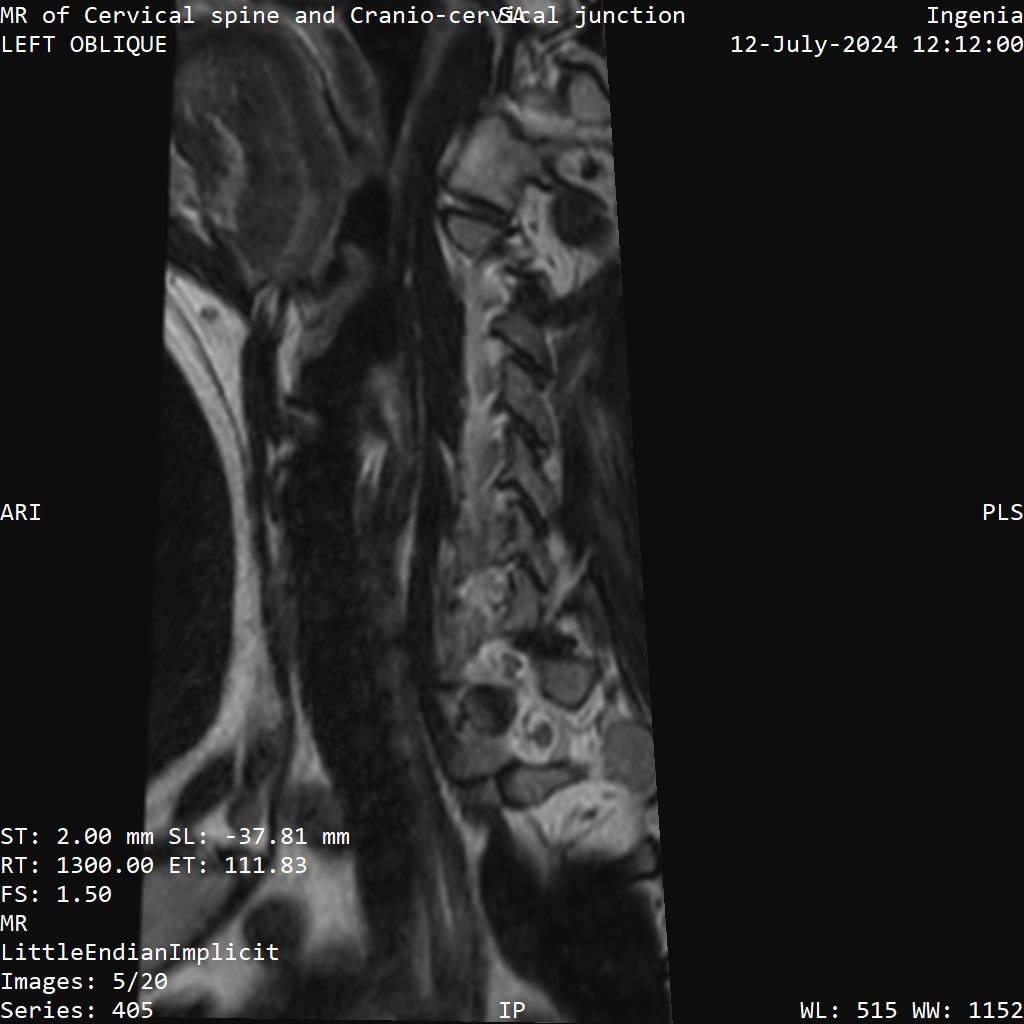
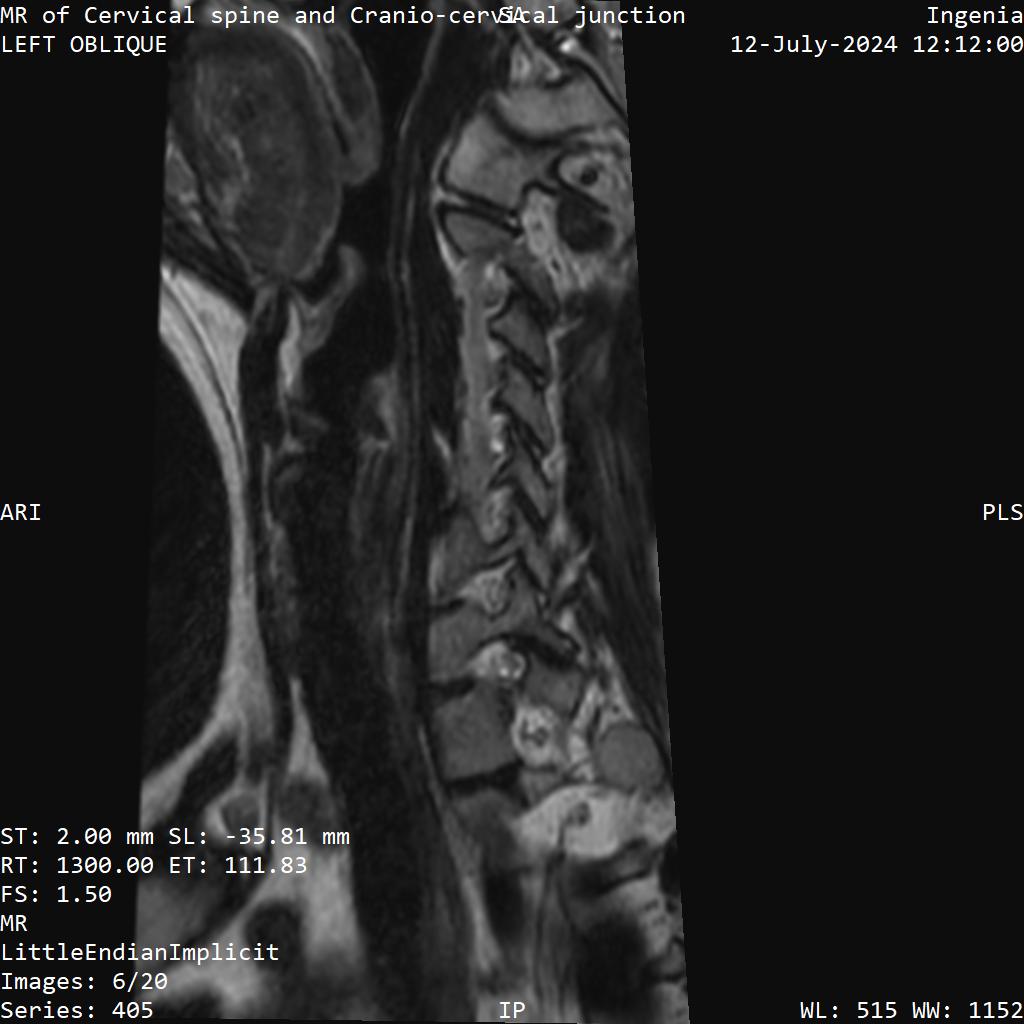


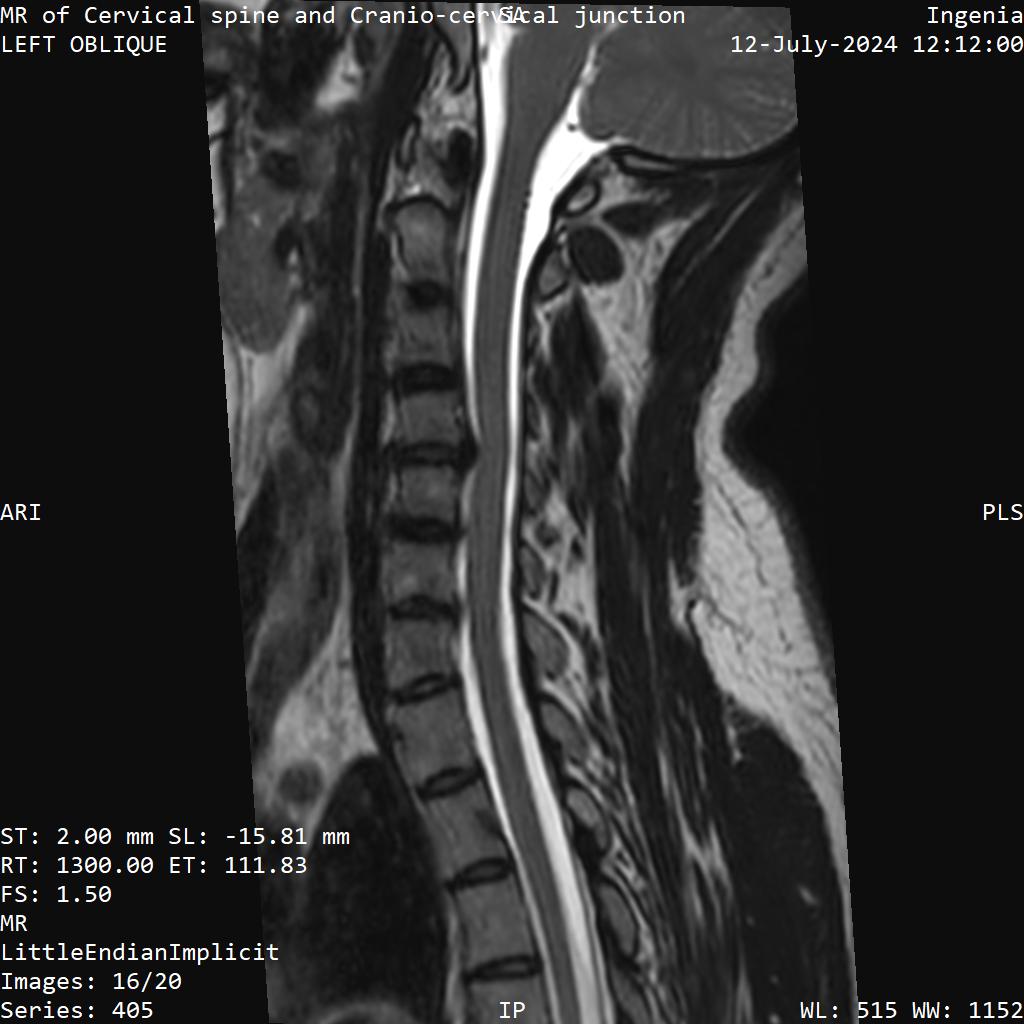


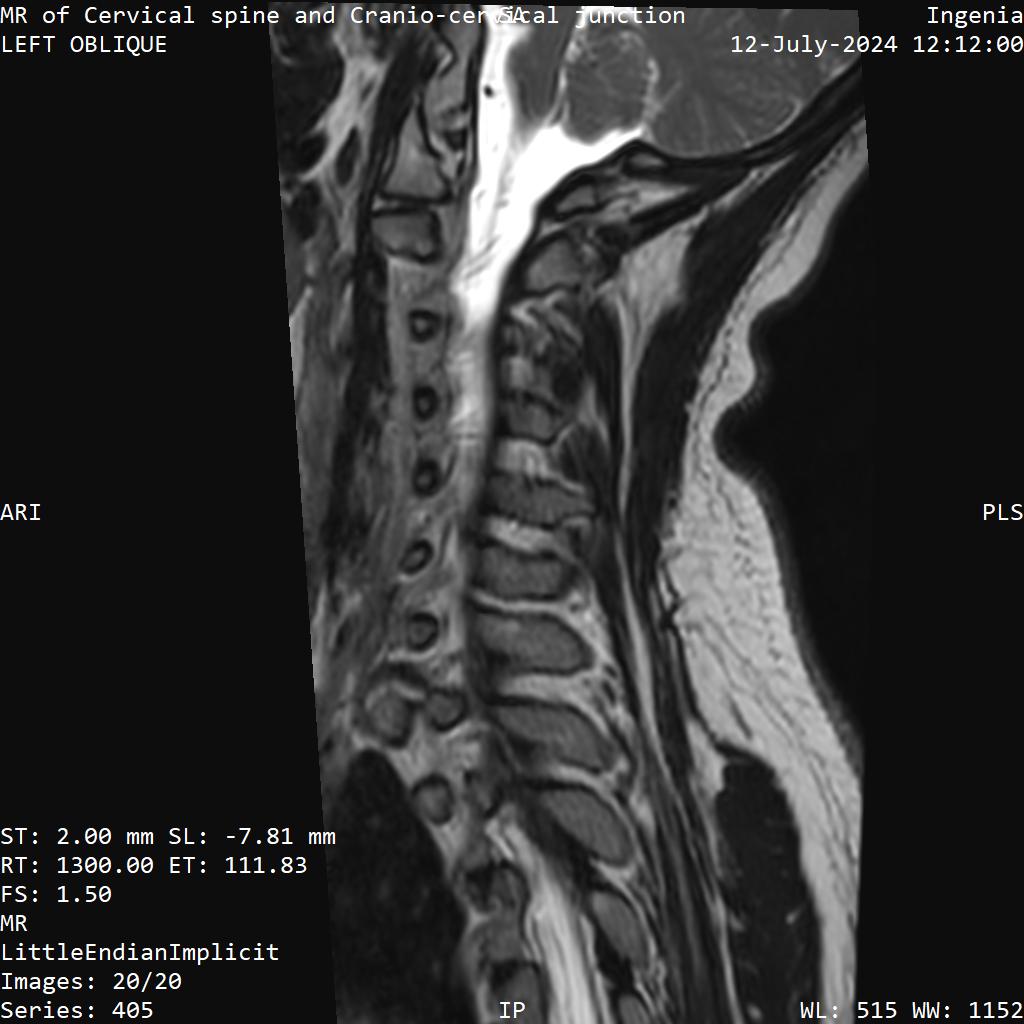
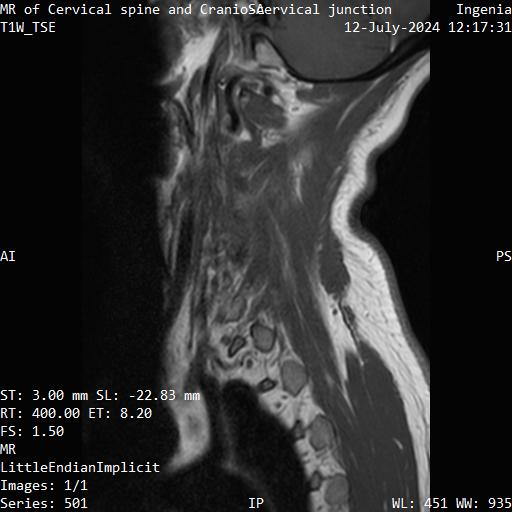
This is an MRI from 2022, T2 sequence. Right in the area of the marginal and supramarginal gyrus, there is this area of atypical cortical architecture, which the radiologist interpreted as microgyria.
The same pathology is present on the 2024 MRI, now in T1 sequence. In this sequence, the difference is much clearer. Just look closely at the difference between the adjacent normal cortex and this area. In all other respects, the brain is clean. There aren't even foci of age-related vascular gliosis to latch onto, which is commendable, as by 30-40 years of age, people typically develop some small subcortical foci.
It's difficult now to assess the probability of this being a congenital or acquired condition, as it's impossible to know if they were present in her childhood.
Now, if we analyze your wife's symptoms in detail, her clinical presentation is very similar to the course of multiple sclerosis, with symptoms resembling relapses and remissions. Your wife's MRI is clean. Yes, there are cases where the MRI is clear at the very beginning (less than 1% of cases), and even those are explained by technical issues, lack of imaging of other areas like the spinal cord, or radiologist negligence regarding incidental and seemingly nonspecific foci. However, within 6 months to 1 year, visible lesions typically appear, even if the brain MRI was initially clear. In your wife's case, over almost 2 years, not a single lesion has appeared. Clinically it resembles MS, but the MRI picture is paradoxical. Even in primary progressive MS, lesions are visible in the spinal cord.
Regarding the spinal images, I'm not an expert and don't specialize much in paraspinal tissues like vertebral pathology or tissues adjacent to the spine. However, I am well-versed in the spinal cord. And I can say this: there are no lesions in your wife's spinal cord. I tried to spot any hyperintense areas, but they simply aren't there. Regarding spinal cord compression, yes, I agree. There is a protrusion into the spinal canal, but as you yourself understand, this DOES NOT explain the other symptoms at all.
Unfortunately, both in my case and in your wife's case, doctors have stopped the diagnostic search, which is disheartening. But still, after all these years, you haven't lost heart and are trying to find a logical explanation, which is good.